- June 3, 2022
- Posted by: Shane Daly
- Category: Trading Article
Combining the trend following characteristics of moving averages and the measure of recent price changes with the RSI, can make for a good strategy. We are essentially looking to take advantage of a momentum move in price in the direction of the short term trend.
We’ve always heard if you catch the turn, you can ride a big move. Catching the trend change turn is not always possible, comes with more chance of failure, and this is even more accurate if just trading moving average crossovers. With a small bit of knowledge of price action and the increase momentum indication given by the RSI, we may be able to enter somewhere close to the turn.
Moving Average + RSI Settings
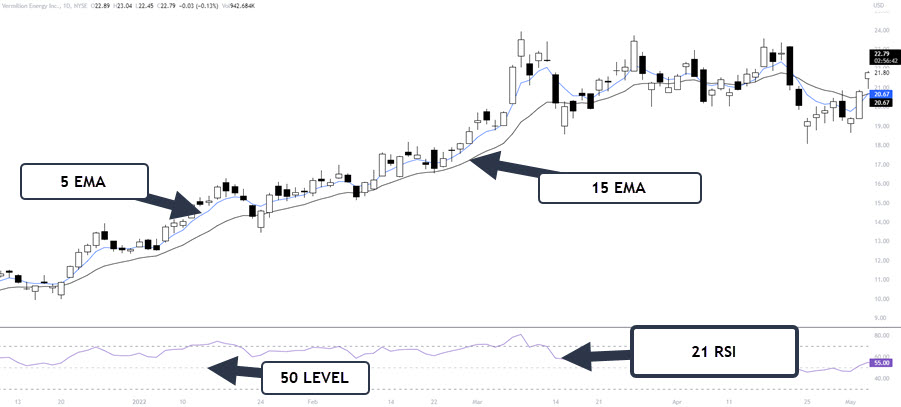
There are no best settings but there are shorter and longer term settings. For our purposes, since we are looking for a trend change with momentum, we will use a 5 period exponential moving average and the 15 period EMA. We want to make sure that we are getting into a trade when momentum is strong enough to change the trend.
Our RSI will be set to 21 periods and will only use the 50 level as part of our trading conditions.
Timeframes To Use
I prefer daily charts for setups in my own trading. Doing my work at night and having a plan for the next day is something I prefer. Others may prefer a more active style and use lower time frames such as the 15 minute chart. Intra-day trading comes with some challenges with not only the speed of movement, but also tendencies that happen around the open of the session. It is always possible to catch the start of a trend day which can lead to some great gains.
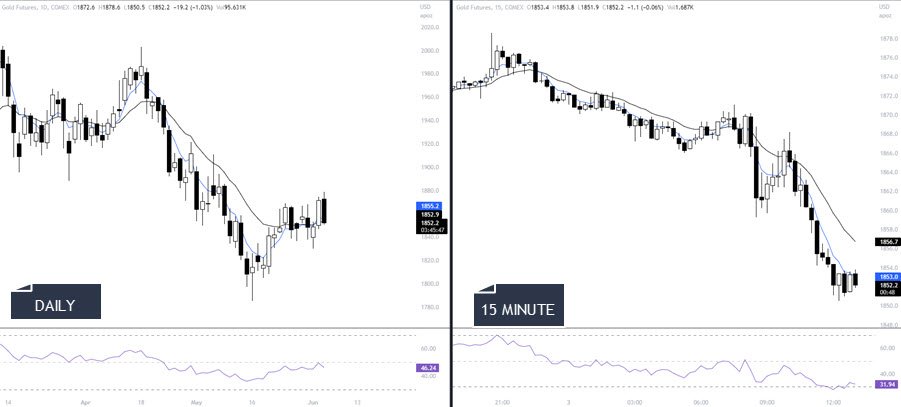
The 15 minute chart is in good shape in this example however with lower time frames, expect whippy price action at times.
What Is The Trading Strategy?
There is no need to complicate things and all we are looking for is a crossover of the averages, the RSI above 50 (for a long), and a trade trigger.
In this daily stock chart example, traders note that price was trending lower as indicated by the moving averages. When price starts to move upwards, the RSI (A) crosses over the 50 level to the upside on a larger candle than the previous ones. The larger candle closing in the upper half of the range is a good sign of interest in this trade direction.
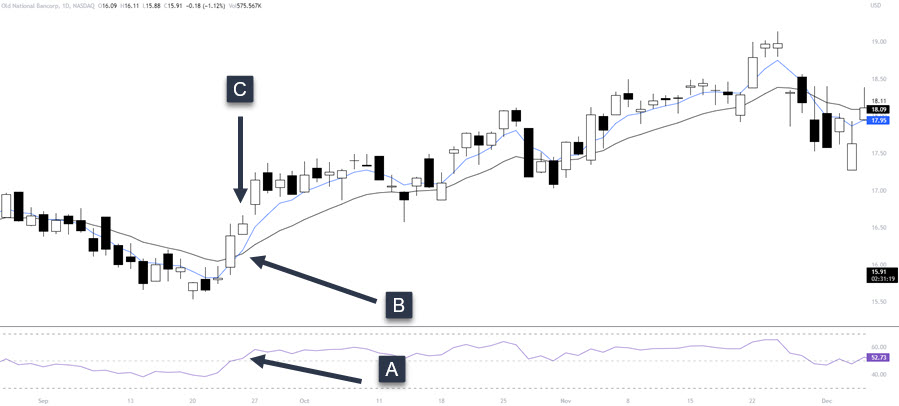
The cross of the RSI is not enough for a trade and at B, we see the moving average crossover giving us a bullish bias. The entry candle is at C. Keep in mind that we can only confirm the crossover near the close of the session or at the close. In our example, price gaps up the next day and you may not be filled. While I could have cherry picked an easy one (I will soon), the fact is that gaps at the open are common and you should know how to handle them.
If you have time during the day to monitor your trades/potential trades, you’d have noted the gap up in price. Also note that price did retrace to fill the gap on the same day and a trader could have entered the daily setup intra-day.
Traders that can’t look at the charts during the day would miss this setup. Hold that thought because we will cover another trade entry to use.
Picture Perfect
Using a 15 minute chart of the ES, we have a setup that is fairly straight forward.
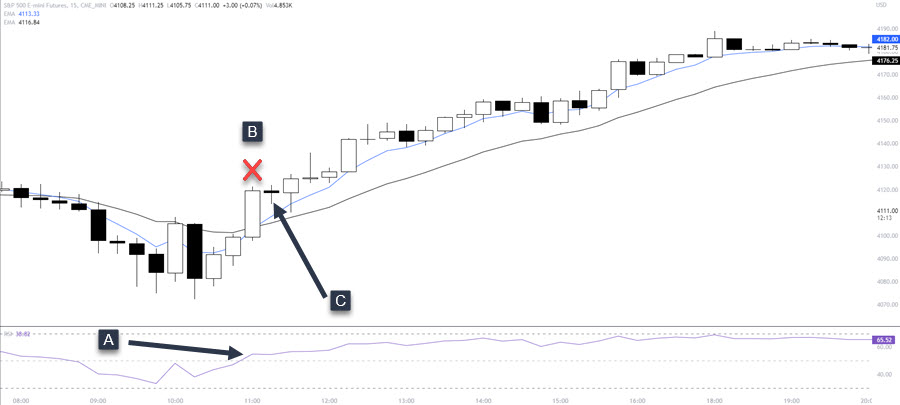
At “A”, we see the RSI is above 50 and was brought there by the bullish candle at B. Note the “X” because at the close of that candle, the 5 period moving average was under the 15 period average. The setup requires, for a long, the 5 above the 15 which we get at “C”. Traders can either enter at close or use a buy stop order over the high of the candle. Price has to move through the high to trigger the trade and you know, at least in the short term, that upside momentum is in your direction.
Taking Out A Swing Level – Conservative Entry Method
An addition to the entry criteria is price taking out a previous swing high for an uptrend and a swing low for a sell. This gives us a price action definition of an uptrend and can be confirmed once a higher swing low is met.
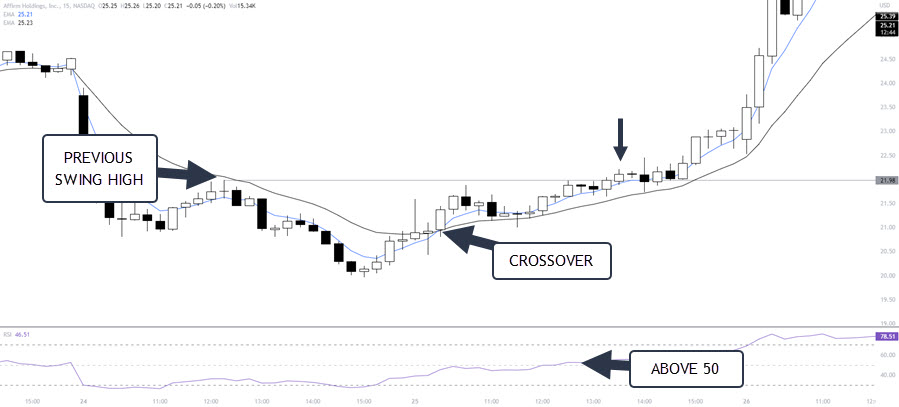
This 15 minute stock chart was trending lower and began to bottom. As price starts to advance, you note the last swing high that was made. This is your line in the sand for a trade entry only when all other conditions are met.
The relative strength index crosses to the top side of the 50 level after the moving average crossover. The basic aggressive entry would have you entering the trade at this point. Using the swing level technique, we need price to break and close over the last swing high. We get that at the black arrow.
Add-on/Re-Entry/Missed Entry Rules
As mentioned, there will be times you miss a trade and one thing we don’t want, is FOMO. You need rules to get into a position because knee jerk reaction trading is the downfall for far too many traders. If you miss a trade, you must get in sync with the strategy and use this technique as a re-entry instead of an add-on trade.
What’s the difference?
If you entered at the first opportunity, you’d be in profit and could use a larger position size on the add-on trade. The longer a trend is in play, the more chance we have of seeing a deeper correction.
If the add-on technique is your first position, do not use full position sizing in order to mitigate the risk of a deeper correction.
This re-entry applies to new positions as well as adding onto your current position if that is your trading plan. The re-entry assumes you took part in the first trade, booked some profits and this is a new position. In that case, you may want to go full position sizing. Only you know your risk appetite.
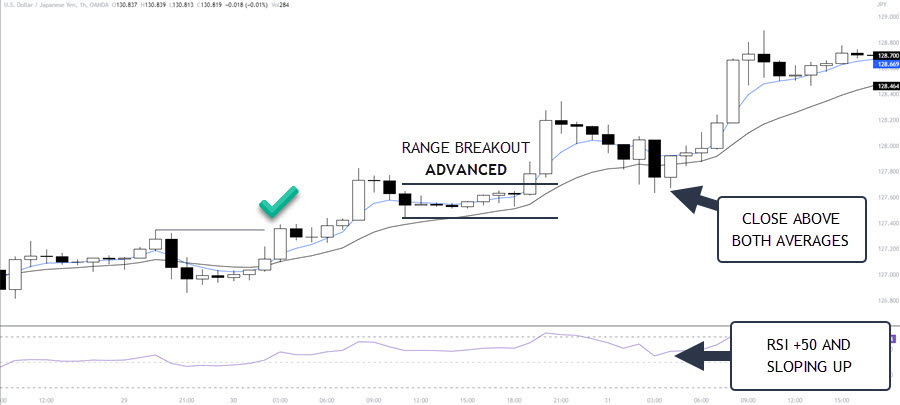
The green checkmark is a legitimate trade. On the right, we see a pullback in price that breaches the moving averages. Note the averages did not cross over and the RSI stayed above the 50 level. A trader can use a buy stop order on the candle that closes above both averages and hooked up the RSI indicator.
In the middle is a trading range. Advanced traders can trade breakouts out of those ranges as long as the averages did not cross and the RSI is still +50.
Stop Loss and Targets
Every trade needs an exit strategy and let’s begin with the stop loss placement. In general, the last swing level/consolidation can be used as the initial protective stop loss area.
Using Bitcoin as our example, we have a recent legitimate buy point off the four hour chart. Prior to the trade, we have a slight consolidation which provides us with an area for our protective stop loss.
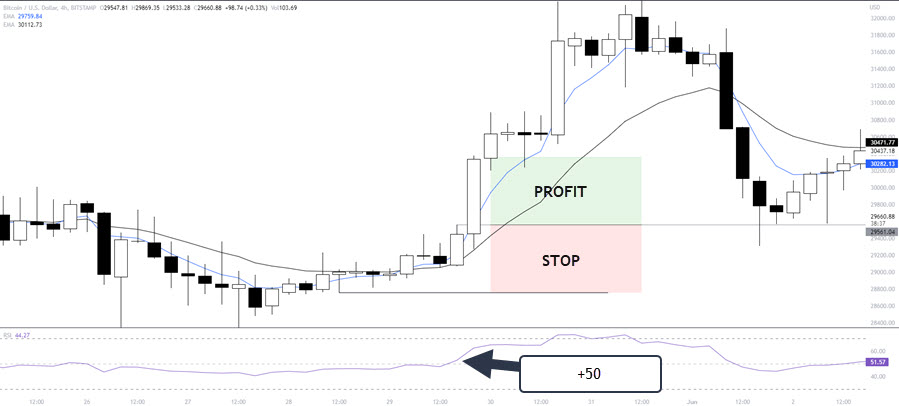
As mentioned in other articles, using a 1R (1 times your risk) profit target is a good way to test the validity of a trading strategy. This example when 1R and onward.

Here we have a legitimate first entry and the stop would go someplace under the consolidation prior to the trade. Since the main swing low is close, some traders may opt for a little more buffer room and use that for the stop. In the middle of the chart, the bottom average is breached and we get a close above the average. The stop loss is below the swing low with a little buffer room.
Don’t complicate the stop location. Have it in a place where if it is hit, the trade was violated and would probably not work out.
Profit Targets
There is no secret for taking profits and a trader can use a trailing stop loss below the 15 EMA, a chandelier trailing stop, multiples of risk, or higher time frame swing highs/lows.
Some traders may just look for a crossing of the averages to the downside or the RSI losing the 50 level. Whatever you use, be consistent.
Pick The Best Chart
Moving averages are great to show an instrument in a consolidation.
When we see the averages whipping around price, we know that the average closes are close to each other. These are the kind of charts to ignore and you’d want to wait until price breaks the range.
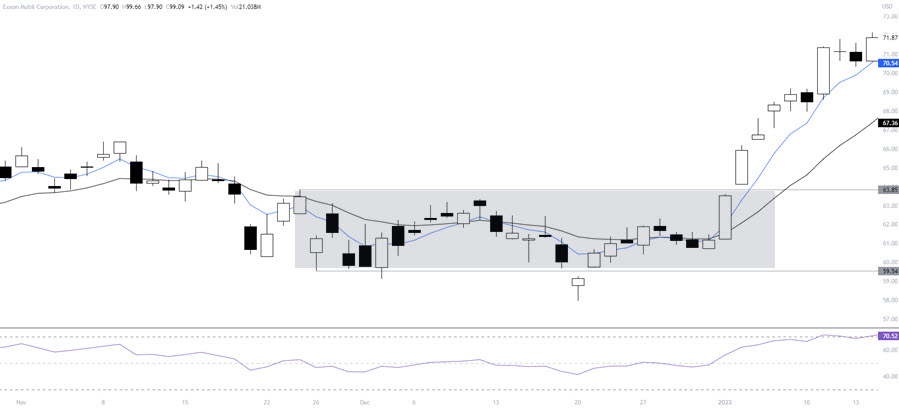
Marking off the highs and the lows of the trading range is a good practice for instruments that you trade on a regular basis. When price breaks out and runs, that is essentially a first trade that you would miss. Look for the re-entry and trade at half of the position sizing as usual.
Closing
When we have momentum in our favor (rising RSI) and an increasing range of closes of price (moving average crossings), we can look to take advantage of pending momentum. Adding in the qualifier of a swing high taken out for a long trade, solidifies you are trading an instrument that is trending up. It may be short lived or it may be the start of a long trend. We never know.
If we don’t know if we are in a new trend move, it does makes sense to consider trailing some of your position. That said, there is something to be said for taking your profits at a multiple of your risk and looking for other opportunities.
