- July 9, 2024
- Posted by: CoachShane
- Categories: Day Trading, Trading Article, Trading Indicators

One of the best volume indicators for day trading is the Volume-Weighted Average Price (VWAP). VWAP provides a clear snapshot by averaging the dollar volume of trades and dividing it by total volume, anchoring the day’s average price to the traded volume.
FREE REPORT: THE #1 Breakout Trading Plan…Grab It Here
To use VWAP, start by setting up the indicator on your trading platform. As prices test the VWAP line, look for price stability or volatility—the VWAP will help indicate bullish or bearish movements. For validation, observe if the price consistently stays above or below the VWAP, aiding in strategic entry and exit decisions.
Main Points
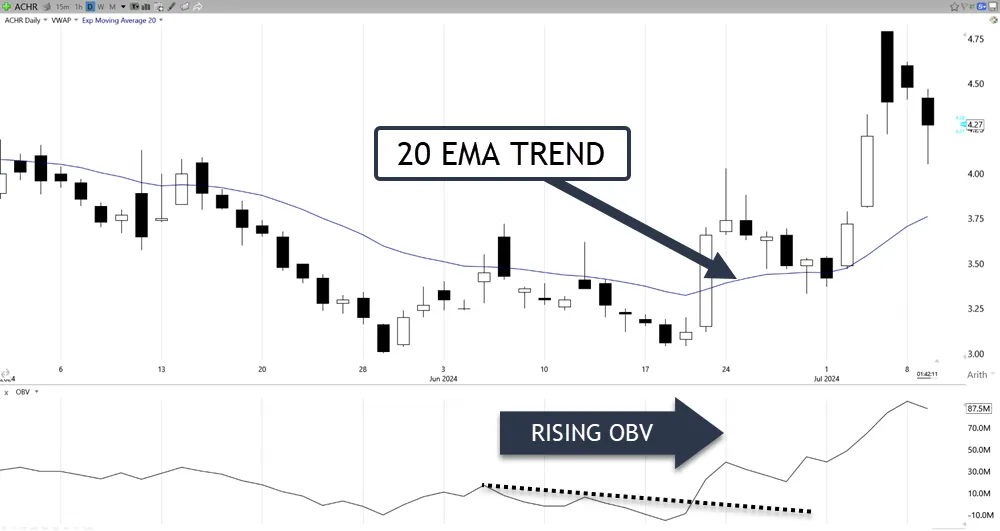
- On-Balance Volume (OBV) is highly effective for tracking momentum with cumulative volume changes.
- Volume-Weighted Average Price (VWAP) offers real-time market sentiment and price action for intraday trading.
- Money Flow Index (MFI) helps identify overbought or oversold conditions, helpful for day trading.
- Using multiple volume indicators can enhance signal reliability and trading strategy effectiveness.
- Continuous testing and adaptation of chosen indicators are essential to match the fast-paced day trading environment.
Understanding Volume Indicators
Volume indicators are essential tools that offer insights into the trading volume, helping traders gauge market sentiment and potential price movements. Understanding these indicators is important for developing effective trading strategies that respond to market conditions.

Volume analysis involves examining the number of shares or contracts traded in a stock or market during a given period. This analysis provides a foundation for predicting future market trends and potential price changes.
When including volume indicators in trading strategies, traders look for patterns and anomalies in trading volume to determine the strength of a price movement. For instance, a sudden increase in trading volume may indicate a pending large move in price, signaling traders to prepare for a potential entry or exit from the market.
On the flip side of that, a decrease in volume might suggest a lack of interest in a current price trend, signaling a possible reversal or slowdown.
Top Volume Indicators Reviewed
Several key volume indicators are fundamental to improving any day trading strategy, each offering unique insights into the volume of each instrument.
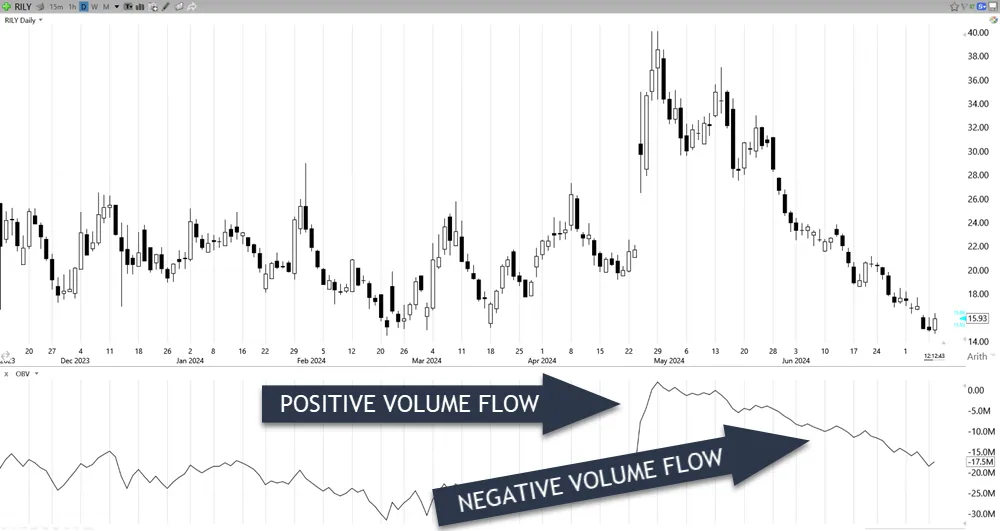
The On-Balance Volume (OBV) is a robust tool that tracks cumulative buying and selling volumes to predict potential market moves based on changes in volume. It adds volume on days the market finishes up and subtracts on days it closes down, assisting traders in confirming the strength of a trend.
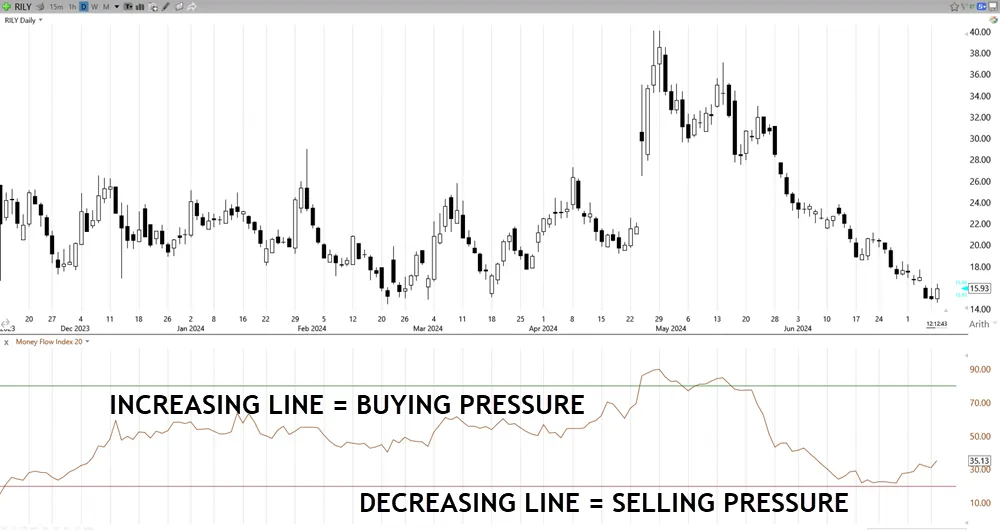
The Money Flow Index (MFI) merges volume and price data to identify overbought or oversold conditions through an oscillator function, offering real-time analysis to forecast market reversals. By comparing inflows and outflows with price movements, traders can better understand the buying or selling pressure behind price changes.
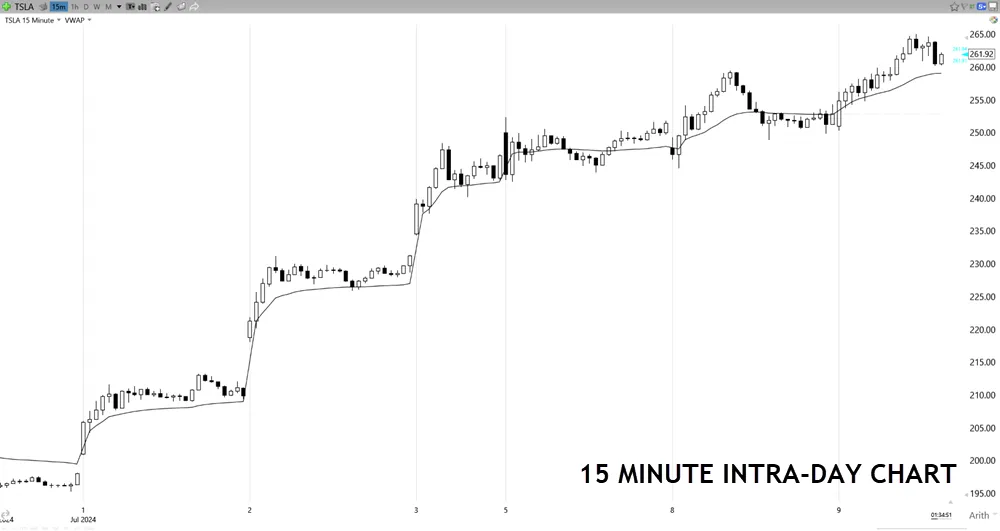
Volume-weighted average Price (VWAP) serves as a benchmark for the day’s price activity, helping traders identify if a security is a good buy or sell during the trading session. It provides a volume indicator comparison by averaging the volume traded at varying prices throughout the day, weighted by volume.
Benefits of Using Volume Indicators
By examining the volume indicator applications, traders can see the strength behind price movements, which is important for confirming potential trade signals. This addition of volume analyses is beneficial in identifying whether a move in price is backed by substantial trading activity or merely speculative noise.

The significance of volume indicators cannot be overstated. They provide essential data that, when used alongside price indicators, allow for a more rounded analysis and superior strategy formulation. This combination helps in pinpointing more accurate entry and exit points, improving the efficacy of day trading practices.
Also, volume indicators are pivotal in recognizing trend patterns and potential reversals. Mastering their use can lead to a deeper understanding of market sentiment and liquidity, enabling traders to make better decisions.
Implementing Volume Indicators
Understanding how to effectively implement volume indicators is vital for day traders aiming to utilize these tools for optimal trading outcomes. To integrate these tools into a day trading strategy, you must first select appropriate volume indicator strategies based on their specific trading style and market conditions.
For instance, the On-Balance-Volume (OBV) works well for tracking cumulative buying and selling pressure, aiding in trend confirmation. Likewise, the Money Flow Index (MFI) can be essential for recognizing market reversals by analyzing both price and volume data.
Modern trading platforms often feature integrated tools like the Volume Weighted Average Price (VWAP), which not only measures trading volume but also provides a weighted average price, assisting traders in making informed decisions about entry and exit points.
Selecting the right combination of tools involves testing different indicators to see which provides the most consistent and reliable signals for your trading strategy. It’s also important to continuously monitor the performance and adjust your approach based on market feedback and personal trading results.
Mastering Volume Analysis Techniques
To master volume analysis techniques, traders must thoroughly investigate the mechanics behind indicators like OBV, MFI, and VWAP, which offer great insights into market dynamics and trader behavior.
Digging further into these indicators can boost your ability to see impactful market trends and make decisions concerning entry and exit points.

Incorporating advanced volume strategies and the practical application of volume analysis requires a clear understanding of how these tools reflect underlying market sentiment and liquidity.
By mastering these techniques, traders can improve their accuracy in predicting short-term price movements, essential for successful day trading.
Here are five key steps to mastering volume analysis techniques:
- Grasp the fundamental functions of each volume indicator to utilize them effectively.
- Integrate volume with price action to confirm trend strength or weakness.
- Monitor divergences between price and volume as potential signals for reversals.
- Steer clear of common mistakes such as ignoring context or over-relying on a single indicator.
- Consistently practice in different market conditions to refine technique and strategy.
Frequently Asked Questions
How Does OBV Differ From Traditional Volume Charts?
OBV, or On-Balance Volume, differs from traditional volume bars by accounting for price movements in its calculations, unlike accumulation distribution which also considers volume but focuses more broadly on price highs and lows.
Can OBV Predict Stock Prices Accurately?
The OBV indicator can predict stock prices by tracking volume changes alongside price movements, enhancing its reliability in stock analysis. However, its effectiveness might be limited by market volatility and atypical volume spikes.
What Settings Are Optimal for OBV in Forex Trading?
The best parameters for OBV in Forex trading generally involve a 14-period setting, although adjustments may be necessary based on technical analysis and individual trading strategies to better capture market dynamics.
How Does Market Volatility Affect OBV Readings?
Market volatility significantly affects OBV readings by amplifying the impact of volume spikes. Such a strong relationship between market volume and OBV is evident, with increased trading activity sharply influencing the indicator’s movements.
Is OBV Suitable for Both Bullish and Bearish Markets?
Yes, OBV is suitable for both bullish and bearish markets. It aids in confirming trends by measuring volume flow, thereby providing valuable insights even in sideways markets where trend confirmation is essential.
Summary
By using top volume indicators such as the Volume Oscillator, On-Balance Volume, and Volume Rate of Change, traders can gain insights into the strength of price movements and market sentiment.
Mastery of volume analysis techniques improves decision-making, supporting the identification of best trading opportunities.