- August 17, 2023
- Posted by: CoachShane
- Categories: Day Trading, Trading Article, Trading Indicators

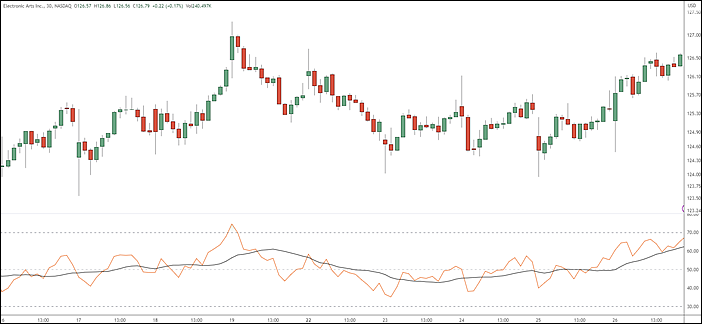
The best RSI settings for day trading depend on individual preferences, market conditions, and trading strategies. Generally, the default setting of 14 periods with an oversold level at 30 and an overbought level at 70 is commonly used.

You’ve heard the saying, ‘buy low and sell high,’ but how do you know when the market is at its lowest or highest point?
That’s where Relative Strength Index (RSI) comes in.
RSI is a popular technical analysis momentum indicator used by day traders to identify overbought and oversold conditions in the market.
But what are the best RSI settings for day trading, and how can you use them effectively?
How RSI Works
The RSI is an oscillator that measures the speed and change of price movements, moving from zero to 100. It is calculated using a simple formula and typically uses a 14-day period for calculation.
- The RSI can identify overbought levels above 70 and oversold conditions below 30
- RSI settings impact sell signals, trend reversals, and divergence signals
- Shorter timeframes increase frequency of extreme RSI values; longer timeframes reduce it
- Default RSI setting is 14 periods; alternative levels like 20/80 or no levels can be used
- Backtesting different settings is essential before live trading
- Adjust RSI parameters based on preference and market conditions for accurate insights
Identifying Oversold and Overbought Conditions
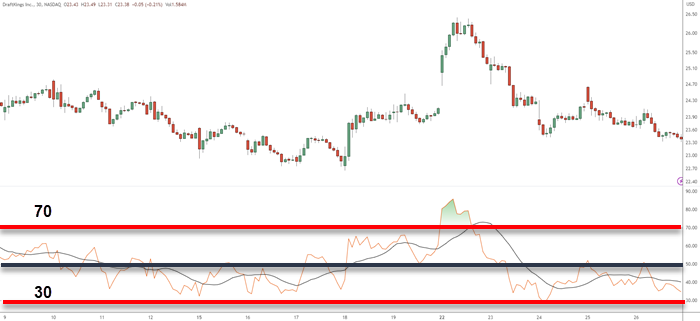
The RSI is categorized as a momentum oscillator, which measures the speed and change of price movements. It moves from zero to 100, with 30, 50, and 70 being the most important levels.

A level below 30 is considered oversold while a level above 70 is overbought. The RSI can be used in any markets and timeframes for trading trends and trend reversals. As one of the most popular indicators for day traders, it can identify overbought and oversold levels as well as bullish/bearish divergences.
However, it’s important to exercise caution when entering short positions during upward trends or buying positions when the RSI drops below 30 during downward trends. The best RSI setting for day trading depends on individual preferences, market conditions, and trading strategies.
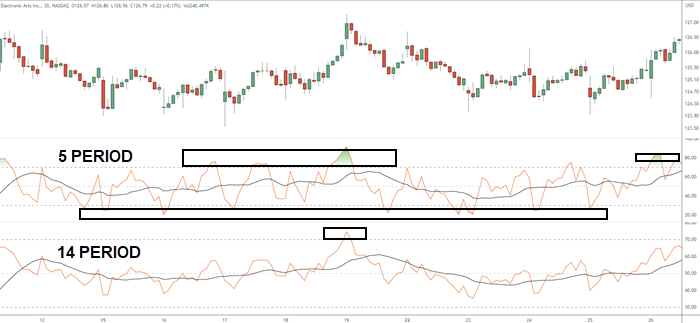
Generally speaking, shorter timeframes cause more frequent extreme values while longer timeframe settings see less frequent values above 70 or below 30. The default setting for RSI is typically set at 14 periods with an oversold level at 30 and an overbought level at 70.
Tailoring RSI Periods to Your Trading Style
The best way to optimize your chart is by adjusting the periods according to your trading strategy and market conditions. The default RSI setting is 14 periods, but this might not be suitable for all traders.
For instance, if you are a day trader, you might want to use a shorter setting that will cause the RSI to reach extreme values more often. On the other hand, if you are a swing trader or position trader, longer timeframe settings will see the RSI indicator reach above 70 or below 30 less frequently.

It’s important to note that changing the period settings affects how frequently the RSI gives overbought and oversold signals as well as divergence signals to buy and sell. Therefore, backtest any changes in settings before implementing them into your trading strategy.
In addition to adjusting period settings, incorporating other technical indicators can help increase accuracy and minimize risk when using RSI for day trading.
Adjusting RSI Settings
Adjusting the RSI settings is easy on most trading platforms, but traders must ensure they understand how these changes affect their strategy before making any modifications. By increasing or decreasing the number of periods used in calculating RSI, traders can adjust their indicator to match their style or market conditions.
For instance, a trader looking for quick profits through intraday trades will likely use a shorter lookback period than someone searching for long-term trends.
Additionally, backtesting different settings using historical data can help identify profitable strategies that work with specific markets and timeframes.
There’s no one-size-fits-all solution when it comes to selecting the best RSI settings for day trading. Traders must experiment with different combinations until they find what works best for them based on their preferences and risk tolerance levels.
RSI and Day Trading
As an intraday trader or swing trader, you want reliable signals that generate profitable trading opportunities. By adjusting the RSI settings to fit your trading style, you can fine-tune this indicator to deliver timely buy and sell signals.
For day traders, using a shorter time periods may be more suitable for generating frequent signals. A 5-period RSI setting could provide a lot of insights in fast-moving markets, while a longer period like 50 may work better for swing traders who are looking for major trend changes.
When it comes to finding overbought or oversold levels with RSI, most traders use default settings of 70/30 regardless of their time frame for trading.
Some experienced day traders prefer tweaking their indicators by changing these levels to 80/20 or even lower depending on market volatility. This approach can increase accuracy in identifying potential turning points in price action.
RSI – Day Trading Divergence
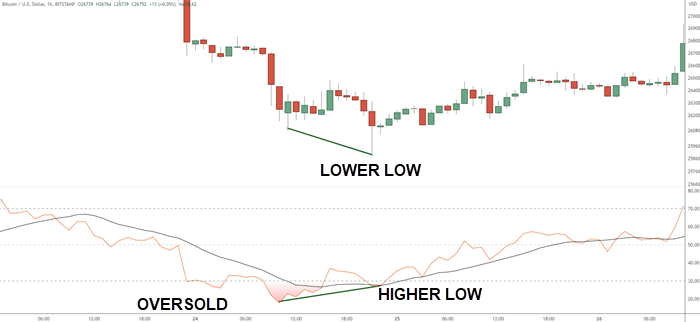
Divergence trading is a strategy involving the Relative Strength Index (RSI). Divergence occurs when an asset’s price moves in one direction while the RSI moves in the opposite direction, indicating a potential reversal.
For instance, this chart reveals a lower price accompanied by a bullish RSI trend, suggesting an upcoming reversal – bullish divergence

However, divergence strategies are more suitable for swing traders and position traders who hold assets for longer periods, rather than day traders. Real divergence takes a time to form as opposed to quick hits because of volatile intra-day price movement.
Other Similar Indicators
While RSI is a popular momentum indicator used by traders in all markets including the stock market. it is not the only technical indicator for day trading. Other indicators such as Stochastic Oscillator, Commodity Channel Index (CCI), and MACD can also be useful in identifying overbought and oversold conditions and trend reversals.
To help you compare these indicators, check out this list:
| Indicator | Type | Overbought/Oversold Levels | Best Settings | Trading Strategy |
|---|---|---|---|---|
| RSI | Momentum Oscillator | Above 70/Below 30 | Default – 14 periods | Divergence & Trend Following |
| Stochastic Oscillator | Momentum Oscillator | Above 80/Below 20 | Default – %K:14 %D:3 | Crossover & Divergence |
| CCI | Momentum Indicator | Above +100/Below -100 | Default – 20 periods | Trend Following & Divergence |
| MACD | Trend-Following Indicator | N/A | Fast EMA:12 Slow EMA:26 Signal Line:9 | Crossover |
Each indicator has its strengths and weaknesses. However, the best settings for day trading will depend on your individual preferences, market conditions, and trading strategies.
When selecting an indicator or combination of indicators for your trading strategy, consider factors such as accuracy of buy/sell signals, ease of use, compatibility with your trading platform, and if they fit your trading style/strategy.
6 Tips for Using RSI in Day Trading
- Use RSI in conjunction with other indicators
- Set appropriate overbought and oversold levels.
- Look for divergence signals between RSI and price.
- Consider the timeframe and adjust RSI period accordingly.
- Combine RSI signals with price patterns for confirmation.
- Remember to practice, stay disciplined, and adapt to market conditions.
Testing an RSI Strategy
Testing an RSI strategy involves using different settings, timeframes, and financial instruments to see how the indicator performs under various market conditions. This process can help you identify potential weaknesses in your strategy and improve its accuracy.
When testing an RSI strategy, it’s important to pay attention to the trading signals generated by the indicator. You should look for entry signals that align with your risk management plan and exit strategies. Factor in trading fees when evaluating the profitability of your strategy.
Some traders use stop-loss orders or take-profit levels to limit their losses or lock-in profits when trading based on RSI signals. To test an RSI strategy effectively, you need to have access to reliable historical data and a platform that allows you to simulate trades realistically.
Many brokers offer demo accounts or backtesting tools that enable you to practice trading without risking real money. Keep in mind that past performance doesn’t guarantee future results, so even if your RSI strategy has worked well in the past, there’s zero guarantee that it’ll continue to be profitable going forward.
Frequently Asked Questions
What are recommended RSI settings for a 5-minute timeframe?
Experiment with values between 5-14 for shorter timeframes, balancing sensitivity and false signals.
What are the optimal RSI settings for swing trading?
Consider periods between 14-30 to capture medium-term price swings and reduce noise.
Can you explain the RSI 2 strategy for day trading?
RSI 2 strategy involves using a 2-period RSI for identifying overbought and oversold conditions in shorter timeframes.
What is the ideal threshold for the RSI indicator?
There’s no universal best limit. Customize levels based on market conditions, asset volatility, and personal preference.
In what time frame is the RSI typically utilized?
RSI can be applied across various timeframes, including intraday, daily, and longer-term charts.
Could you elaborate on the RSI 8 trading strategy?
RSI 8 strategy involves using an 8-period RSI for shorter timeframes, adapting thresholds for entry and exit signals.
Conclusion
You’ve learned about the best RSI settings for day trading and how to use this versatile tool effectively in your trading strategies. By adjusting the RSI settings based on individual preferences, market conditions, and testing different strategies, you can find the optimal setting that works best for you.
With practice and patience, you can become a successful day trader using RSI as part of your arsenal. Test out different RSI settings today – who knows, it might just be the key to unlocking your trading goals you’ve set.
