- August 11, 2024
- Posted by: Shane Daly
- Categories: Trading Article, Trading Indicators

Interpreting Stochastic Oscillator divergence involves identifying discrepancies between an asset’s price movement and the indicator’s momentum reading. This discrepancy can signal potential reversals when the price and oscillator trends don’t align.
To identify bullish divergence, look for instances where the price drops to a new low, but the Stochastic Oscillator trend is higher than its previous low. This indicates that the downward trend is weakening, and bears are losing momentum.
Are you a trader? You need a plan! In this free guide, you’ll learn a step-by-step method to develop a complete trading plan for trading breakouts! If you want to learn to profit from price action, download my Free “Breakout Trading Plan” report NOW!
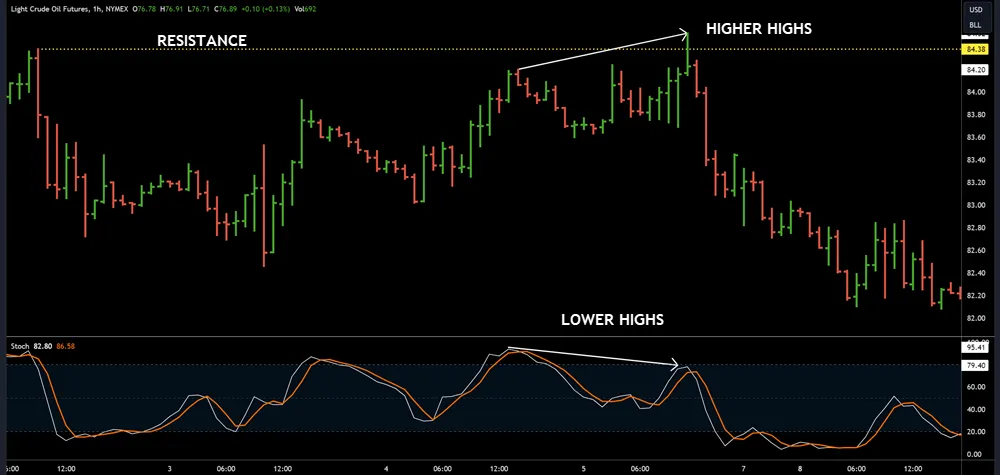
A bearish divergence occurs when the price reaches a new high, but the Stochastic Oscillator trend is lower than its previous high. This suggests that the upward trend is weakening and may soon reverse.
Understanding stochastic divergence signs is essential for developing a comprehensive approach to identifying potential reversals. When analyzing divergence, focus on the relationship between the price and the oscillator trend. If they don’t align, it may indicate a reversal is imminent.
Using Stochastic Oscillator Data
When plotting a Stochastic Oscillator on a chart, two lines are displayed: %K and %D. The %K line shows current price momentum by comparing the latest price to the highest highs and lowest lows over a set period. The %D line is a 3-period simple moving average of %K, which helps to smooth out short-term fluctuations and provides a clearer signal.
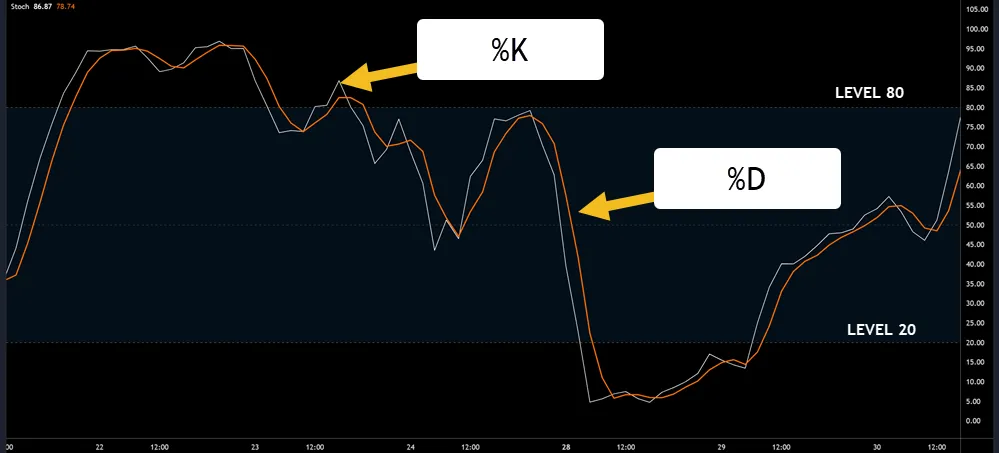
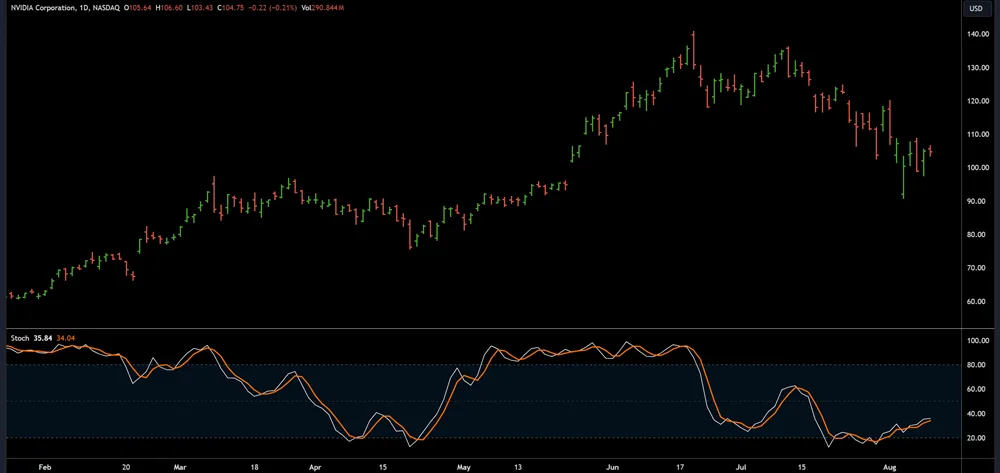
The Stochastic Oscillator is useful for identifying potential market reversals. The oscillator is range-bound between 0 and 100, making it easy to spot overbought and oversold conditions. A reading above 80 indicates an overbought market, while a reading below 20 suggests an oversold market. These conditions can be early signs of a trend reversal.
The Stochastic Oscillator is also used in market trend analysis. By tracking the %K and %D lines, you can gauge the strength of the current market trend and identify potential shifts.
- If the %K line crosses above the %D line, it may indicate a strengthening upward trend.
- If it crosses below the %D line, it may signal a weakening trend.
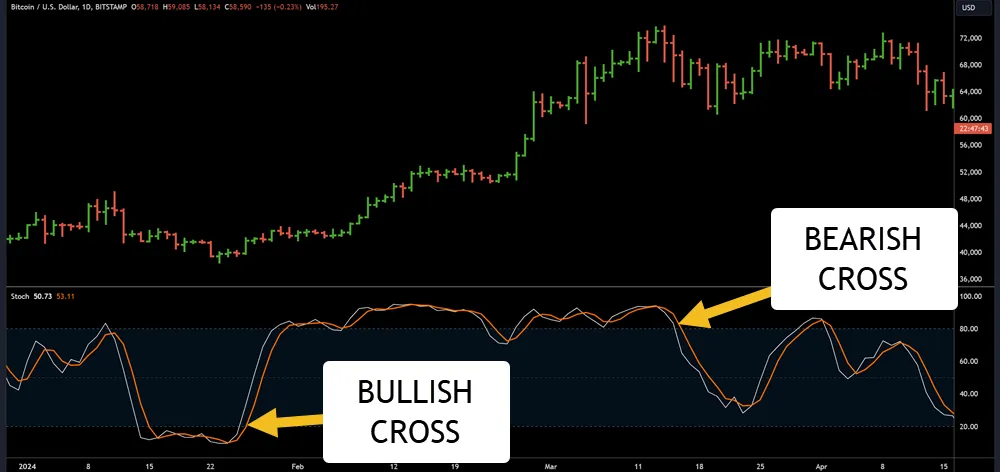
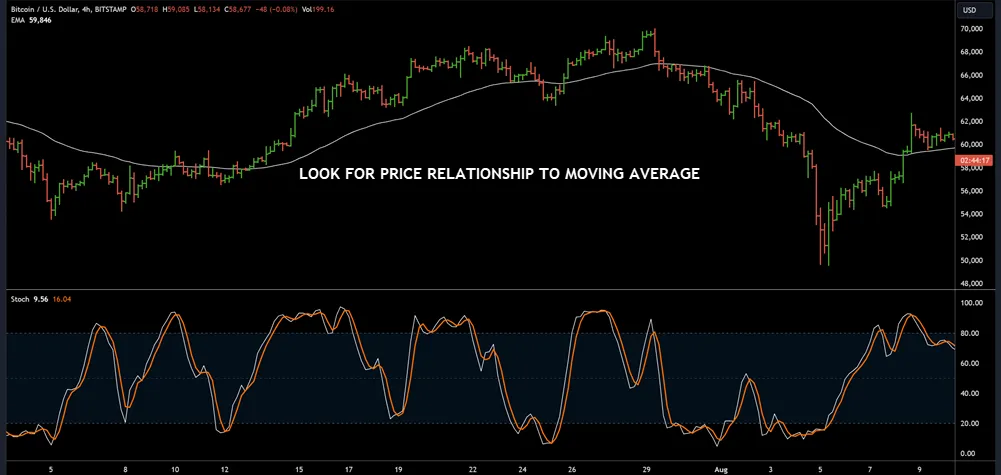
When using the Stochastic Oscillator, combine it with other technical indicators and chart patterns to create a trading strategy. For example, if the %K line crosses above the %D line and another indicator, such as a moving average, also suggests an upward trend, then this can be a signal to enter a long trade.
The Stochastic Oscillator is just one of many tools used in trading. Understanding its strengths and limitations is essential for using it effectively.
Identifying Bullish Divergence
Identifying bullish divergence involves looking for instances where the price reaches a lower low, but the Stochastic Oscillator records a higher low. This signals a potential reversal of the bearish trend. The divergence doesn’t directly indicate a trend reversal but provides a strong hint that the downward trend might be losing momentum.
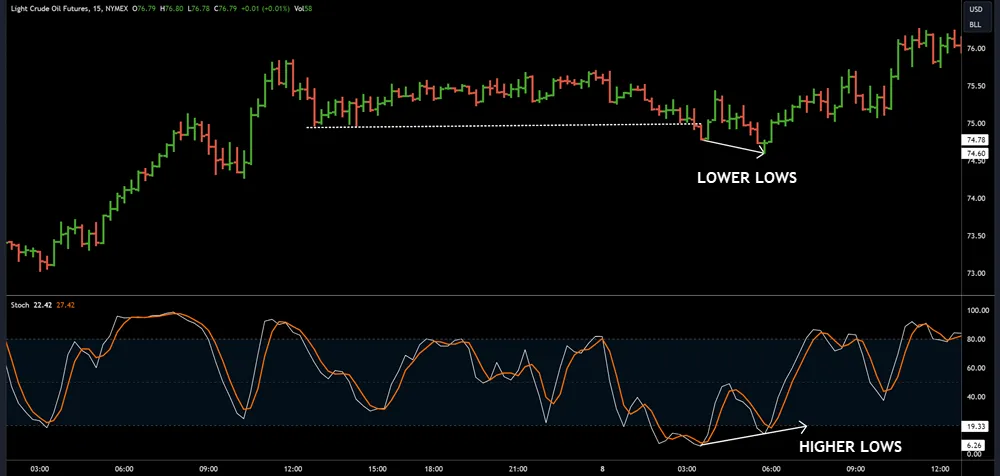
When analyzing the Stochastic Oscillator, observe how it can reach higher lows while the price hits new lows. This discrepancy between price action and the oscillator’s movement makes bullish divergence valuable.
Recognizing these divergences helps anticipate a potential trend reversal. The divergence serves as additional confirmation that the bearish trend/correction might be ending and a bullish reversal is near.
A higher low on the Stochastic Oscillator indicating divergence with price action requires further confirmation before entering a trade. Combine this bullish divergence with other technical indicators, such as moving averages and the Relative Strength Index (RSI), to gain confidence in your trading decision. Integrating these tools validates potential bullish signals and improves trading accuracy.
Overbought and Oversold Signals
The Stochastic Oscillator helps traders identify potential price reversals by providing overbought and oversold signals. It does this by measuring how far its readings are from neutral levels. This is useful because it highlights areas where price action may not be sustainable.
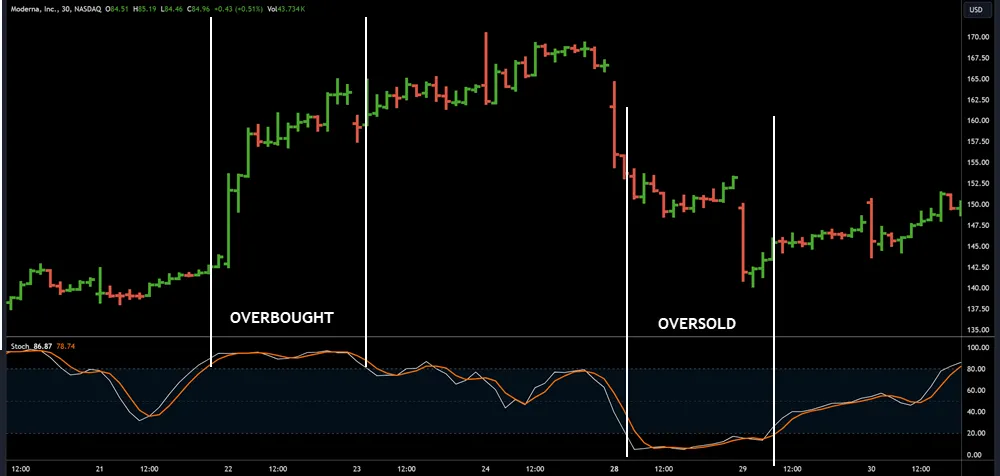
A reading above 80 indicates overbought conditions. This means the asset’s price is near the top of its range, and a price drop is possible. A reading below 20 signals oversold conditions. This means the price is near the bottom of its range, and a price increase is possible. These extreme conditions can be early warnings of potential reversals.
To use these signals effectively, consider the trend and context. In a strong uptrend, overbought conditions may persist without an immediate reversal. In a downtrend, oversold conditions may continue without an immediate price rise.
It’s essential to understand that overbought and oversold conditions don’t always lead to reversals. Sometimes, these conditions can persist for a while. By combining the Stochastic Oscillator with other forms of analysis such as price action, you can increase the accuracy of your trading decisions.
Incorporating Lane’s Methodology
Incorporating George Lane’s methodology into your analysis helps identify potential reversals by spotting divergences between the asset’s price and the Stochastic Oscillator.
To apply Lane’s principles effectively, focus on the following key points:
Bullish Divergence
A bullish divergence occurs when the asset’s price makes a new low, but the Stochastic Oscillator forms a higher low. This indicates a weakening downward trend. The divergence suggests that downward momentum is slowing, which could lead to a trend reversal.
Bearish Divergence
A bearish divergence occurs when the asset’s price makes a new high, but the Stochastic Oscillator forms a lower high. This indicates a weakening upward trend. The divergence suggests that upward momentum is slowing, which could lead to a trend reversal.
Analyzing Multiple Time Frames
Use the Stochastic Oscillator on different time frames to gain a comprehensive view. Short-term divergences can signal short-term reversals, while long-term divergences may indicate more significant trend shifts.
Combining with Other Indicators
To strengthen the signal, combine Lane’s methodology with other technical indicators, such as moving averages or RSI. This helps filter out false signals and increases the accuracy of your analysis.
Calculating Fast and Slow Stochastics
Calculating Fast and Slow Stochastics involves two formulas: %K and %D.
The %K formula calculates the fast stochastic value by subtracting the lowest price over a chosen period from the current closing price. This value is then divided by the difference between the highest and lowest prices over that period and multiplied by 100.
%K = ((Current Close – Lowest Low) / (Highest High – Lowest Low)) * 100
The %D formula calculates the slow stochastic value as a 3-day simple moving average (SMA) of the %K line. This line helps smooth out the fast stochastic noise and acts as a signal line. When %K rises above %D, it indicates a potential uptrend. When %K falls below %D, it indicates a potential downtrend.
%D = 3-day SMA of %K
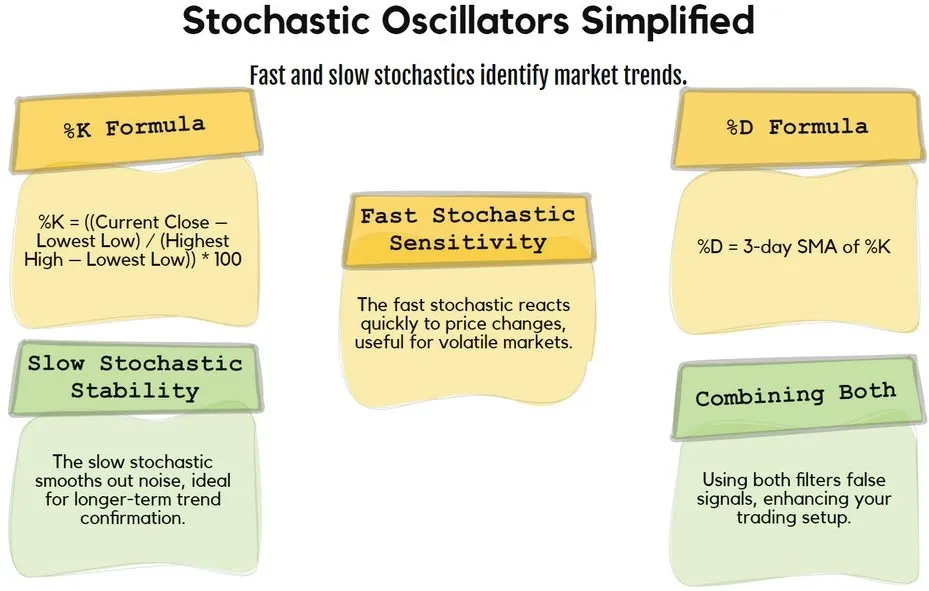
The fast stochastic is more sensitive to price movements and is often used for entry and exit points in volatile markets.
The slow stochastic is less reactive to short-term price fluctuations, making it suitable for confirming trends and longer-term strategy decisions.
By combining both, you can filter out false signals from the fast stochastic, making it a valuable addition to your trading setup.
Trading Decisions From Divergences
The stochastic oscillator relies on crossovers and divergences to guide trading decisions when price and momentum diverge. Interpreting these signals correctly can be a part of a successful trading strategy.
Remember, regular divergence occurs when the price reaches a new high or low, but the stochastic oscillator does not. This can be either bullish or bearish, indicating a potential market reversal.
Key Points for Trading with Divergences
- Align price movement with divergence: Ensure the price is moving in the same direction as the divergence. This confirms the signal’s validity.
- Stay disciplined: Divergences can be emotionally challenging due to conflicting signals. Stick to your chosen strategy.
- Verify with other indicators: Cross-check the divergence signal with other technical tools or chart patterns to get a comprehensive view of market dynamics.
- Timing is crucial: Divergence signals are most reliable when they coincide with significant market levels or patterns, such as support and resistance areas.
Incorporating these considerations into your trading approach can improve the effectiveness of your divergence strategies. A well-planned strategy helps you make informed trading decisions and navigate the markets with confidence.
Frequently Asked Questions
Can the Stochastic Oscillator Be Used for Both Trending and Ranging Markets?
The stochastic oscillator is a versatile tool that can be used in both trending and ranging markets. Its primary function is to identify overbought and oversold conditions, making it useful for detecting potential reversals. In trending markets, the stochastic oscillator helps traders pinpoint areas where the trend may be exhausting itself, indicating a possible correction.
In ranging markets, it aids in finding reversals, allowing traders to capitalize on price movements within a specific range. To maximize its effectiveness, traders should combine the stochastic oscillator with other technical analysis tools and adapt their strategy to the specific market conditions.
Are False Signals More Likely During Very Volatile Market Conditions?
Volatile market conditions require caution. When market noise increases, so does the likelihood of false signals from the stochastic oscillator. This reduces signal reliability. To manage this, combine the stochastic oscillator with other indicators. This approach helps to filter out false signals and provides a more accurate picture of market trends.
In very volatile markets, the stochastic oscillator may produce more frequent and extreme readings. This can lead to incorrect buy or sell signals. To avoid this, use the oscillator with other technical indicators, such as moving averages or trend lines. By combining these tools, you can increase the accuracy of your market analysis and make more informed trading decisions.
Can the Stochastic Oscillator Serve as a Standalone Trading Strategy?
Using the stochastic oscillator alone may not be enough for a reliable trading strategy. It is best to combine it with other technical tools to achieve better results. While stochastic signals can provide valuable trading insights, relying solely on these signals may lead to inconsistent outcomes.
To maximize the effectiveness of the stochastic oscillator, consider pairing it with other technical indicators or chart patterns. This combination can help filter out false signals and increase the accuracy of your trading decisions. By using the stochastic oscillator in conjunction with other tools, you can develop a more comprehensive trading strategy that helps you navigate the markets with confidence.
Conclusion
To effectively use stochastic oscillator divergence, focus on identifying bullish divergences, spotting overbought and oversold signals, and incorporating Lane’s methodology into your trading strategy. This combination of techniques can help you better predict potential reversals and improve your trading decisions.