- November 15, 2024
- Posted by: CoachShane
- Categories: Swing Trading, Trading Article, Trading Indicators
If you want to improve your swing trading strategy, you’ll find that technical analysis can provide the foundation for better trading decisions. While there’s no shortage of indicators and tools available, focusing on a few key ones can significantly boost your trade timing and risk management. You’ve seen come various technical indicators, but knowing which ones to prioritize and how to combine them can make the difference between consistent profits and a long string of losses.
What are Zero-DTE Options? => Download “Zero-DTE Options Trading Secrets” right here
Highlights
- Use the 20 EMA as your primary indicator for swing trades, as it provides decent signal strength and reliability for medium-term positions.
- Combine RSI readings above/below 50 with MACD crossovers to confirm trend direction and identify high-probability entry points.
- Place stop-loss orders based on major support/resistance levels and limit risk exposure to 1-2% of total trading capital per trade.
- Look for breakout patterns with strong volume confirmation to identify potential swing trading opportunities with clear entry points.
- Take partial profits at predetermined technical targets while moving stop-loss to breakeven to protect gains and maintain trading discipline.
Utilize Moving Averages and Momentum Indicators
The Exponential Moving Average (EMA) is especially useful for spotting price trends, as it responds more quickly to recent price changes than simple moving averages.
The Relative Strength Index (RSI) helps you identify if a stock is overbought or oversold, making it easier to time your entries and exits.
When you combine these with the Moving Average Convergence Divergence (MACD), which shows momentum shifts through its signal line crossovers, you’ll have a solid foundation for making better swing trading decisions.
Exponential Moving Average (EMA)
The Exponential Moving Average (EMA) is a common technical indicator for swing traders, giving a more responsive view of price action compared to its simple moving average counterpart. You’ll find that EMA strategies work best when you’re looking to identify trend direction and potential entry points. By focusing on EMA trends, you can spot market momentum shifts faster than with traditional indicators.
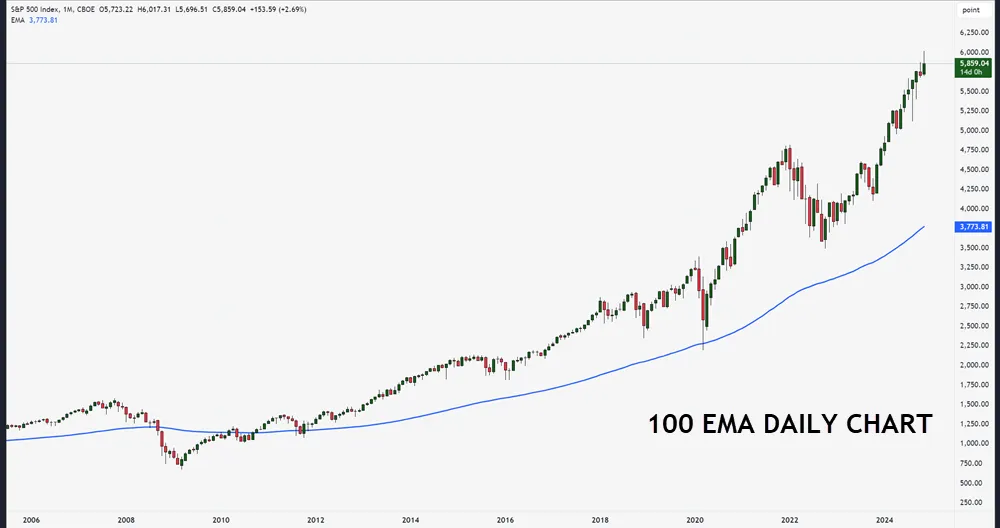
Here’s a practical guide to common EMA settings and their applications:
| Timeframe | EMA Length | Best Used For | Signal Type | Reliability |
|---|---|---|---|---|
| Intraday | 9 EMA | Quick trades | Fast signals | Moderate |
| Daily | 20 EMA | Swing trades | Medium signals | High |
| Weekly | 50 EMA | Trend following | Strong trends | Very high |
| Monthly | 100 EMA | Long-term trends | Major support | Highest |
| Yearly | 200 EMA | Market direction | Ultimate trend | Maximum |
When you’re using EMA crossover strategies, watch for when faster EMAs cross slower ones – these often signal potential trade opportunities. EMA inclinations can help you determine trend strength; steeper angles typically indicate stronger trends. Start with the 20 and 50 EMA combination for ideal swing trading results.
Relative Strength Index (RSI)
Building on the momentum knowledge from EMAs, the Relative Strength Index (RSI) offers swing traders a tool for measuring market conditions and identifying potential reversals. You’ll find the RSI particularly useful for spotting when assets are overbought or oversold, helping you make smarter entry and exit decisions.
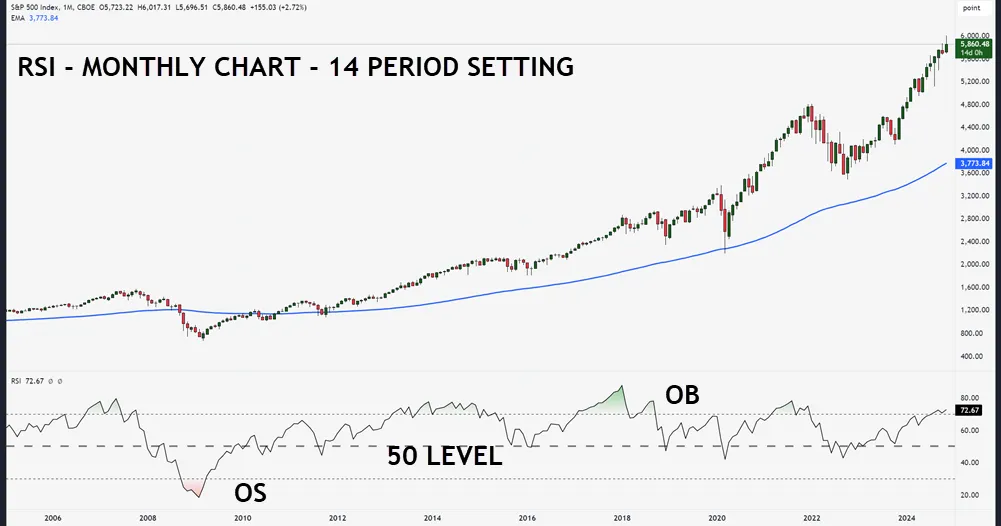
The momentum oscillator calculation involves measuring average gains versus losses over a specific period, typically 14 days, to gauge price momentum strength.
When you’re analyzing RSI, focus on the traditional overbought level of 70 and oversold level of 30. These boundaries help you spot potential trend reversals but don’t rely on them alone. Consider RSI divergence analysis, where the price moves in one direction while RSI moves in another – this often signals an upcoming reversal.
You can improve your analysis by comparing RSI timeframes, using both shorter and longer periods to confirm trends.
For effective RSI trend confirmation, watch how the indicator behaves around the centerline (50). When the RSI stays above 50 during pullbacks, it’s typically a bullish signal. Similarly, readings consistently below 50 suggest bearish conditions.
Remember to combine RSI with other indicators you’ve learned, as no single tool works perfectly by itself in a trading strategy.
Moving Average Convergence Divergence (MACD
Among momentum indicators, MACD is a popular tool that combines moving averages with momentum analysis to help identify trend direction and potential reversals.
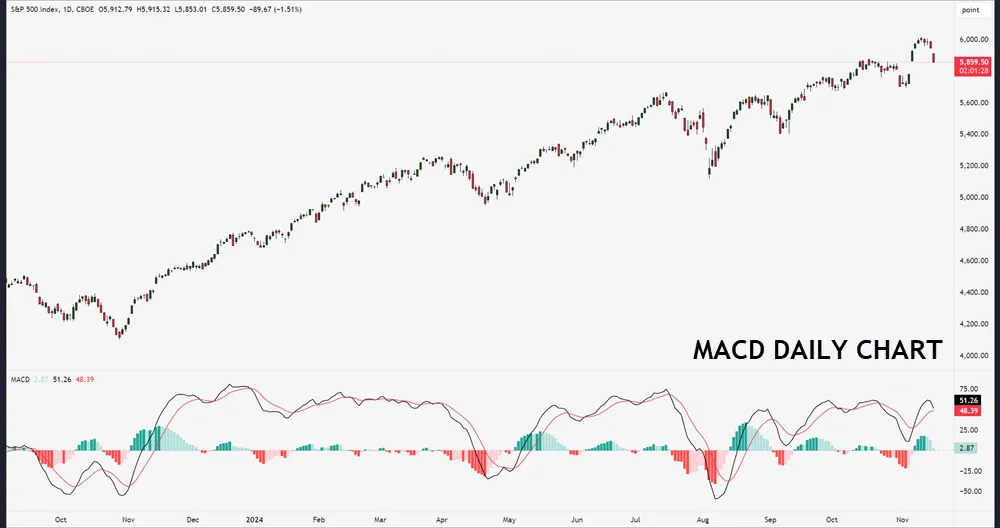
You’ll find it particularly useful for signal line interpretation and spotting momentum shift identification in your trading decisions.
When you’re analyzing charts, the MACD helps you understand market momentum by showing the relationship between two moving averages. Using standard settings (12,26,9) allows for consistent analysis across different timeframes and markets.
- Look for MACD divergence strategies when the price moves in one direction but the indicator moves in another – this often signals potential reversals
- Watch the histogram analysis techniques to gauge momentum strength and potential trend changes
- Pay attention to when the MACD line crosses above or below the signal line for potential entry and exit points
- Use trend-following applications by tracking the MACD line’s position relative to the zero line
- Combine MACD readings with other indicators for more reliable trading signals
Master Chart Patterns and Support/Resistance Levels
Learning to spot chart patterns like breakouts and breakdowns will show you the best times to enter and exit your trades.
Trading levels significance increases when price points haven’t been retested since their initial swing highs or lows, making first revisits especially powerful.
You’ll want to watch for classic reversal patterns that signal when a stock might change direction, including head-and-shoulders formations and double tops or bottoms.
Trading within trend channels can help you set clear profit targets while managing your risk, as these patterns create natural boundaries for price movement.
Breakouts and Breakdowns
Successful swing traders rely on three key price movements: breakouts above resistance, breakdowns below support, and the follow-through momentum that occurs afterward.
When you’re tracking bullish breakouts, look for prices that decisively push above resistance levels with strong volume confirmation. Similarly, bearish breakdowns happen when prices fall below support with increased selling pressure.
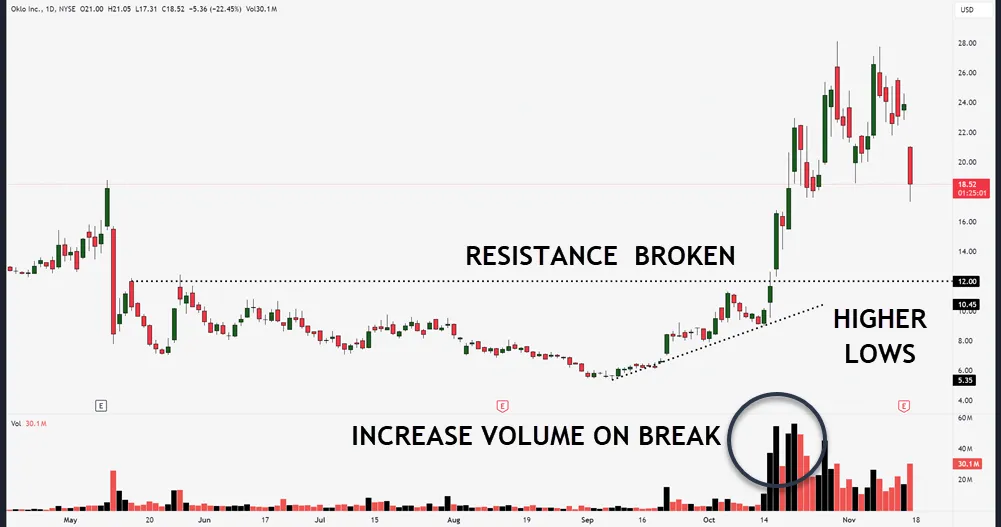
Understanding range trading patterns during consolidation phases can help identify potential breakout and breakdown zones with greater accuracy.
Here’s what you need to watch for when trading breakouts and breakdowns:
- Volume should spike significantly during the initial price move to confirm true breakout strength
- Price action should maintain its new level for at least two trading sessions to validate the move
- Watch for breakout retests of the former support or resistance level, which often provide entry opportunities
- Be cautious of false breakdowns, which can quickly reverse and trap traders on the wrong side
- Monitor market sentiment and sector trends to support your breakout trading decisions
Remember that not every breakout or breakdown leads to a profitable trade. You’ll want to wait for clear confirmation before entering positions, and always use stop-loss orders to protect against failed moves.
The most reliable setups often occur when multiple technical indicators align with the breakout direction (confluence).
Reversal Patterns
Technical reversal patterns are a great way to help you spot potential trend changes before they fully develop. When you’re swing trading, identifying chart reversals early can give you a significant advantage. Look for common candlestick patterns like double tops, head and shoulders, or evening stars to confirm trend reversal opportunities.
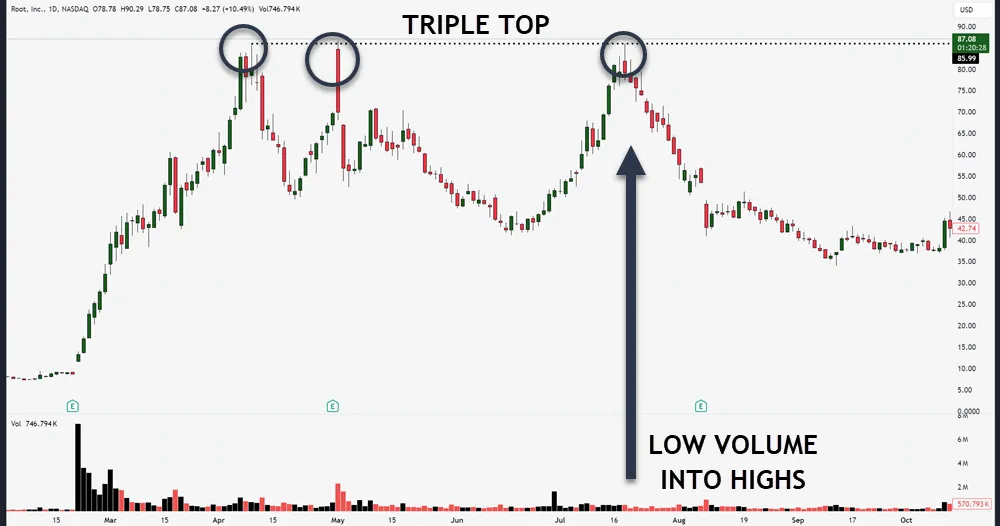
Pay attention to divergence signals between price action and technical indicators, as they often highlight potential reversal zones. You’ll want to combine multiple indicators to strengthen your analysis and reduce false signals.
| Pattern Type | Reliability | Best Timeframe |
|---|---|---|
| Double Top/Bottom | High | Daily |
| Head & Shoulders | Medium | 4-hour |
| Evening/Morning Star | High | Daily |
| Triple Top/Bottom | Medium | Weekly |
| V-Shaped Reversal | Low | Intraday |
When you spot these patterns, don’t rush into a trade immediately. Wait for confirmation through supporting volume, momentum indicators, and price action. Look for reversal patterns at key support and resistance levels, as they’re more likely to trigger significant moves.
Successful trading isn’t just about identifying patterns – it’s about managing your risk when acting on them.
Trend Channels
While reversal patterns help identify trend changes, trend channels provide a powerful framework for tracking price movements within established boundaries. You’ll find that these parallel lines, drawn above and below the price action, create a clear visual cue for your trading decisions.
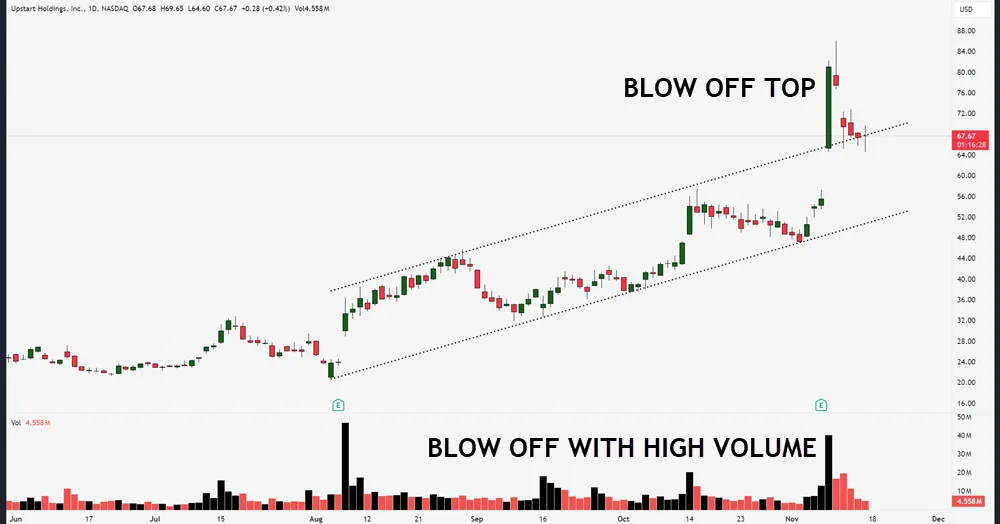
Using trend identification techniques, you can spot these channels by connecting a series of higher highs and higher lows for uptrends, or lower highs and lower lows for downtrends. Multiple timeframe analysis improves signal reliability by revealing dominant trends across various timeframes, particularly when evaluating channel formations.
Here’s what you need to know about channel trading strategies:
- Price tends to bounce between the upper and lower channel boundaries, creating predictable trading opportunities
- Strong breakout confirmation signals occur when prices move decisively outside the channel
- The longer a channel holds, the more significant its support level significance becomes
- Channel width can help determine position sizing and stop-loss placement
- Price action analysis within channels often reveals momentum shifts before breakouts occur
When you’re working with trend channels, focus on the quality of your trendlines. Don’t force channels to fit – they should form naturally from price movements.
Remember that channels can be drawn on any timeframe, but longer timeframes typically produce more reliable signals for swing trading.
Implement Risk Management and Position Sizing
When you’re swing trading, protecting your capital through smart risk management is just as important as finding the right trades.
Establishing clear risk evaluation criteria and developing a systematic approach to managing emotional responses during market volatility will strengthen your trading performance.
You’ll want to start by setting clear stop-loss orders to limit potential losses and use position sizing that ensures no single trade risks more than 1-2% of your total trading account.
Taking partial profits as your trades move in your favor helps lock in gains while letting the remaining position potentially capture bigger moves.
Set Stop-Loss Orders
Setting proper stop-loss orders is your first line of defense against significant trading losses. You’ll need to master various stop loss strategies to protect your trading capital and maintain consistent profits.
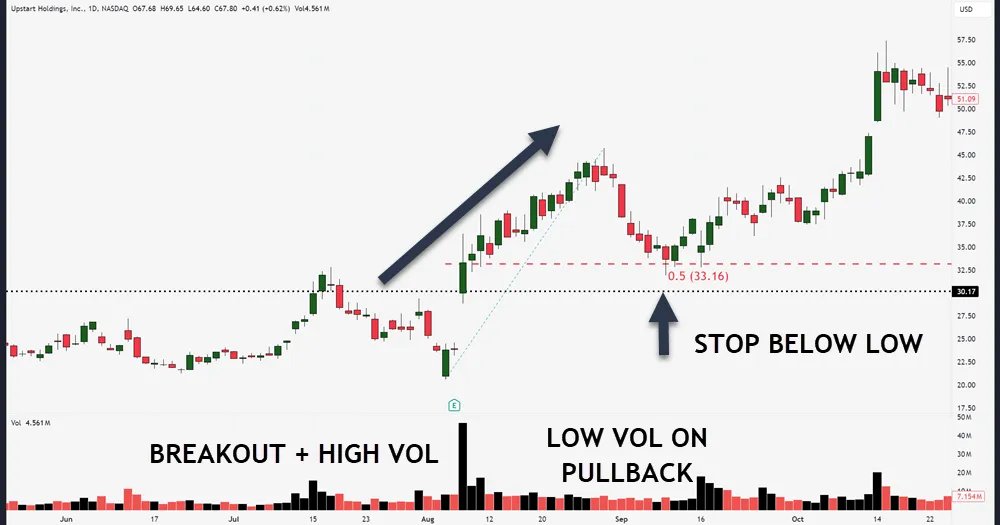
Using stop loss automation can help remove emotional decision-making from your trading process, ensuring you stick to your predetermined exit points.
Here are key considerations for effective stop-loss placement:
- Place your stop loss just below major support levels or above resistance levels, depending on whether you’re long or short.
- Use trailing stop loss orders to lock in profits as the trade moves in your favor.
- Set a psychological stop loss based on your risk tolerance and maximum acceptable loss.
- Consider volatility when determining stop loss distance – wider stops for volatile stocks, tighter for stable ones.
- Always factor in the bid-ask spread when setting your stops to avoid premature exits.
Remember that your stop loss shouldn’t be so tight that normal market fluctuations trigger it, nor so wide that it exceeds your risk tolerance.
Use Proper Position Sizing
Proper position sizing stands up against emotional overtrading as one of the most critical aspects of successful swing trading. Before placing any trade, you’ll need to conduct a risk tolerance assessment to determine how much capital you’re comfortable risking on each position. This is the foundation of your position sizing strategy.
| Aspect | Description | Example |
|---|---|---|
| Total Trading Capital | The total amount available for trading | $50,000 |
| Risk Tolerance Rule | Maximum percentage of capital risked per trade | 1% rule |
| Maximum Risk per Trade | Calculated amount based on risk tolerance | $500 (1% of $50,000) |
| Entry Point | Planned purchase price of the stock | $50 per share |
| Stop-Loss Level | Price at which you’ll exit to limit losses | $48 per share |
| Risk per Share | Difference between entry and stop-loss | $2 ($50 – $48) |
| Position Size Calculation | Maximum risk divided by risk per share | 250 shares ($500 / $2) |
| Total Position Value | Number of shares multiplied by entry price | $12,500 (250 * $50) |
| Percentage of Capital Used | Position value as a percentage of total capital | 25% ($12,500 / $50,000) |
To implement effective position sizing, start by determining your total trade exposure for each position. You shouldn’t risk more than 1-2% of your total trading capital on any single trade. Consider the stock’s volatility measurement when calculating your position size – highly volatile stocks typically require smaller positions to manage risk effectively.
Your capital allocation strategy should reflect both your risk tolerance and market conditions. For example, if you’ve got $50,000 in trading capital and you’re following the 1% risk rule, you wouldn’t risk more than $500 per trade.
To calculate your position risk, factor in the distance between your entry point and stop-loss level. If you’re planning to buy a stock at $50 with a stop-loss at $48, that’s a $2 risk per share, which means you could purchase 250 shares ($500/$2).
Take Partial Profits
Building on smart position sizing principles, taking partial profits helps you manage risk while keeping skin in the game. By scaling out of positions gradually, you’ll maintain emotional discipline while protecting your gains against market volatility.
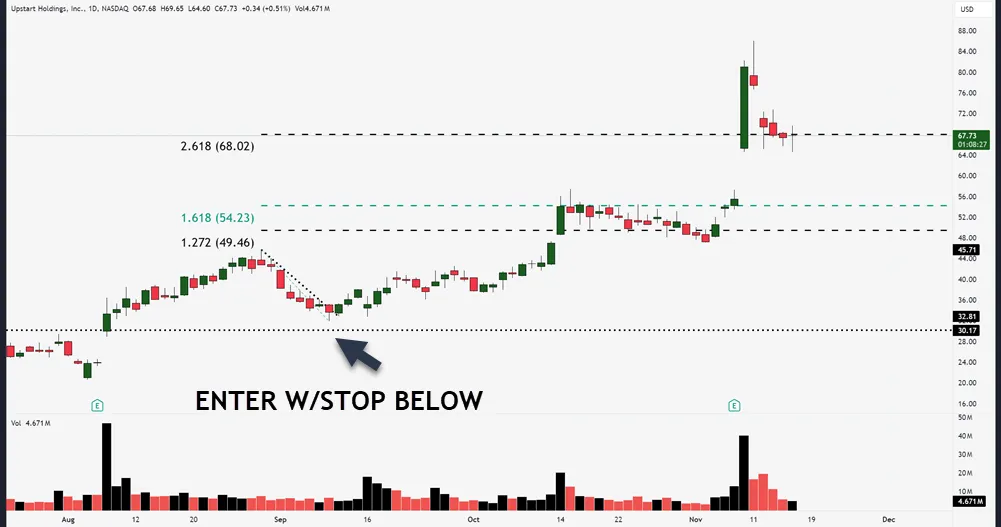
Your exit strategies should include multiple profit targets, allowing you to capture the upside while reducing exposure.
Here’s how to implement a solid partial profit approach:
- Set predetermined profit targets at key technical levels before entering any trade
- Close 1/3 of your position at your first target to lock in initial gains
- Move your stop loss to breakeven after taking partial profits
- Document your exits in your trade journaling to analyze what works best
- Adjust your targets based on current market conditions and volatility levels
Taking partial profits isn’t about maximizing every trade – it’s about consistently capturing gains while managing risk.
When you scale out of positions, you’re less likely to make emotional decisions about holding or exiting your entire position. This approach helps you stay objective and focused on your trading plan, especially during volatile market conditions.
Remember that consistent small wins add up to long-term success in swing trading.
Your Questions Answered
How Long Should I Hold a Swing Trade Position on Average?
You’ll typically want to hold your positions for 2-10 days, but your trade duration strategies should depend on trend analysis techniques, market volatility impact, and how well your entry point timing aligns with risk management practices.
What Percentage of My Portfolio Should I Allocate to Swing Trading?
You’ll want to limit swing trades to 10-20% of your portfolio for proper risk management. This helps maintain portfolio diversification and emotional discipline while protecting against market volatility. Adjust trade volume based on experience.
Which Timeframes Work Best for Scanning Potential Swing Trading Opportunities?
You’ll usually find that daily and 4-hour timeframes most effective for scanning opportunities. Perform your scans nightly, use multiple timeframe confirmations, and adjust based on market volatility to identify reliable swing trading setups.
Should I Swing Trade During Earnings Season or Major Economic Events?
You’ll want to carefully assess volatility and manage risk during earnings season. Consider sector performance and news influence before trading, as earnings impact can create unpredictable price swings that may challenge your strategy.
What Is the Minimum Account Size Recommended for Swing Trading?
You’ll want at least $10,000 to effectively implement swing trading strategies and risk management techniques. This allows you to diversify positions, maintain proper position sizing, and handle potential losses while developing your trading psychology.
Conclusion
By following these technical analysis tips, you’ll be better able to make better trading decisions. Remember to combine the 20 EMA, RSI, and volume analysis to spot potential opportunities while protecting your capital through smart position sizing and stop-loss orders. Don’t forget that successful swing trading requires patience, discipline, and a well-planned strategy. Keep practicing these techniques, and you’ll develop a more confident trading approach.
