- November 20, 2024
- Posted by: Shane Daly
- Categories: Day Trading, Trading Article
If you’re struggling to determine market direction during intraday trading, you’re not alone. Understanding price action can transform your trading by revealing the market’s true intentions before major moves occur. While many traders rely on complex indicators, price action provides clearer signals about market bias through its raw, unfiltered movements.
Whether you’re day trading stocks, forex, or futures, mastering the art of reading price action patterns and market structure will help you spot high-probability trade setups and align yourself with the dominant market direction.
Role of Intraday Market Bias
Market bias tells you the overall direction prices are moving during your trading day, which helps you spot better trading opportunities that match the market’s flow.
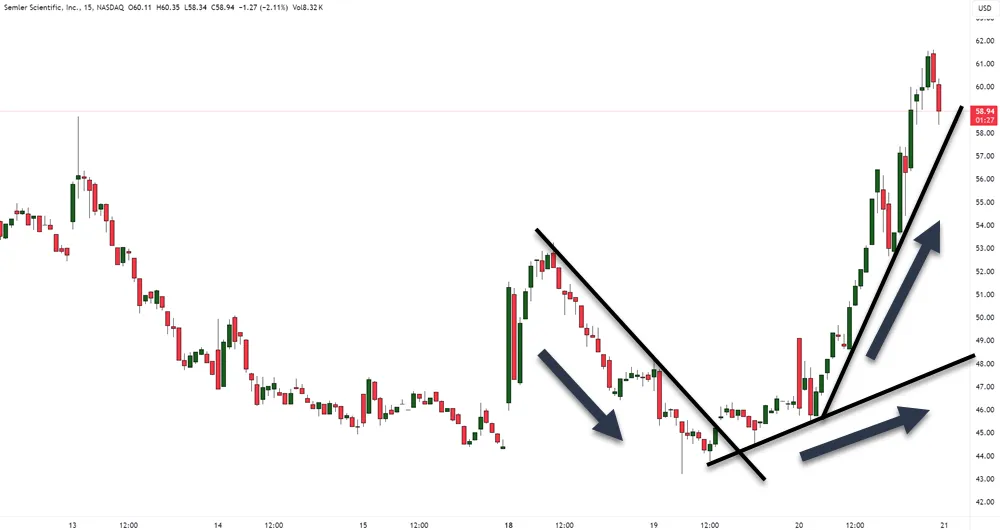
Understanding daily chart patterns helps reduce emotional trading and promotes more educated decision-making when analyzing market bias.
You’ll find it easier to make trading decisions when you understand whether the market’s leaning bullish or bearish, as this guides your entry and exit points or whether or not to take a trade.
When you line up your trades with the market’s bias, you’ll increase your chances of success since you’re trading in harmony with the dominant price movement rather than fighting against it.
What is Market Bias?
Market bias represents the overall tendency of prices to move either up or down, influenced by various factors including market sentiment, trading psychology, and economic indicators.
Think of market bias as the path of least resistance that prices are likely to follow. When you’re analyzing market bias, you’ll need to consider how news impact affects price movements and monitor volatility analysis to gauge market strength.
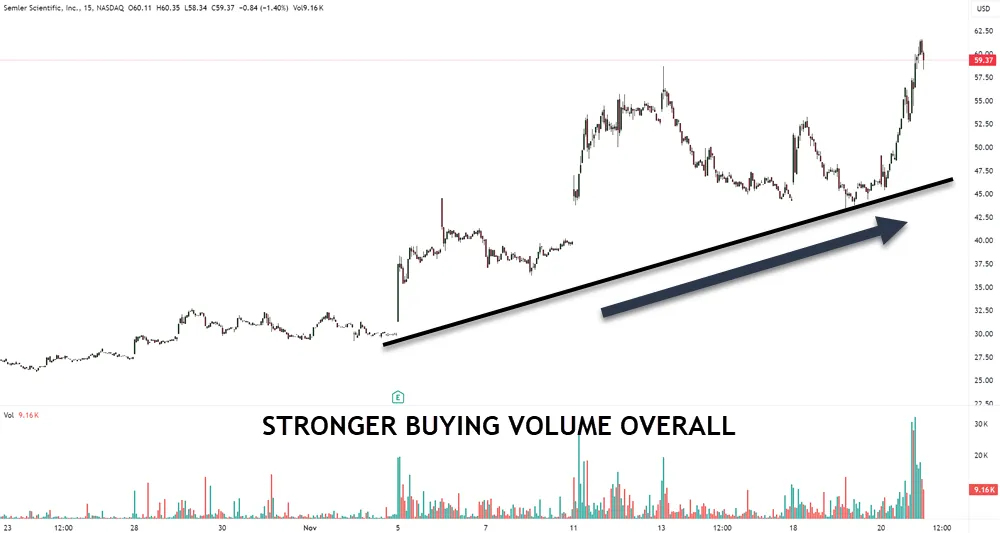
Market bias isn’t just about whether prices are moving up or down; it’s about understanding the strength and conviction behind these moves. You’ll often notice that even in choppy markets, there’s usually an underlying bias that becomes apparent when you step back and look at the bigger picture.
This broader perspective helps you avoid fighting against the market’s natural flow and instead align your trades with the prevailing direction.
How Market Bias Influences Trading Decisions
The influence of intraday market bias on trading decisions can’t be overstated – it serves as a map for directing daily price movements.
Understanding how market bias affects trader psychology impact is important for your success. When you’re aware of the prevailing bias, you can select the right time frame selection for your trades and properly weigh market news influence on your decisions.
This awareness helps you avoid trading against the trend and potentially losing money.
- Trading with the bias increases your probability of successful trades since you’re moving in the same direction as the market’s momentum.
- Your risk management becomes more effective as you can set more accurate stop-loss and take-profit levels.
- You’ll experience less emotional stress when your trades align with the market’s natural direction.
- Position sizing becomes more strategic as you can adjust based on how strongly the bias confirms your trading setup.
Market bias isn’t static – it can shift throughout the day, so staying alert to these changes is essential for maintaining your trading edge.
Recognizing Bias in Different Market Conditions
Successful traders recognize that intraday bias shows up differently across various market conditions – from trending to ranging, volatile to calm. You’ll need to adapt your approach based on how price action behaves in these distinct environments.
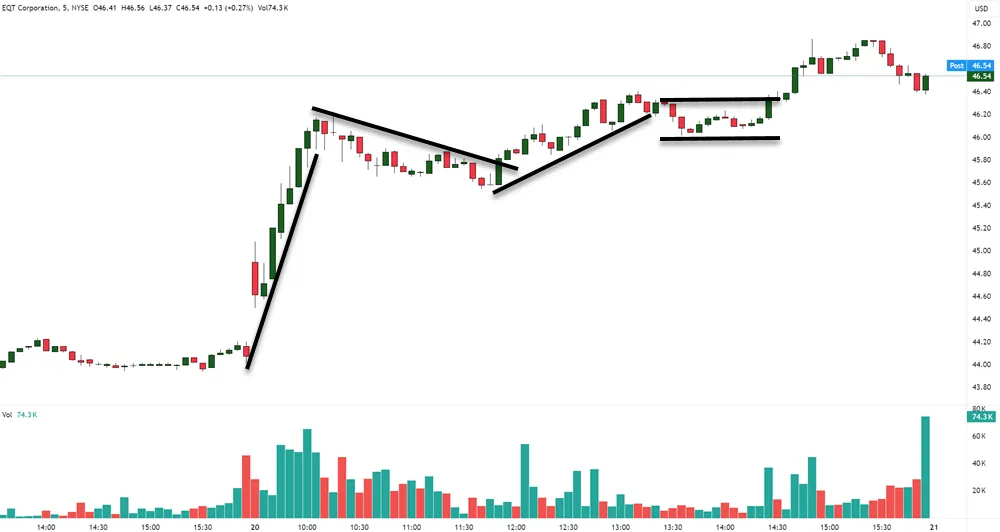
During high market volatility, price movements become more aggressive, creating wider swings that can signal a strong directional bias. Watch for breakout patterns that occur after price consolidation periods, as these often indicate where the market’s heading.

When markets are calmer, you’ll notice smaller price ranges and more subtle clues about direction.
Market sentiment plays a role in determining bias. If you’re seeing higher highs and higher lows forming, that’s typically bullish sentiment at work. On the flip side, lower highs and lower lows suggest bearish pressure. Understanding trader psychology helps too – when most traders are positioned one way, the market often moves in that direction.
Remember that bias isn’t static – it can shift throughout the day. Pay attention to how price reacts at key levels. If it’s respecting support and resistance consistently, you’ve got a ranging market.
If it’s breaking through levels with strength, you’re likely in a trending market.
Techniques for Identifying Intraday Market Bias
You can spot the market’s direction by watching how prices move between key support and resistance levels throughout the day.
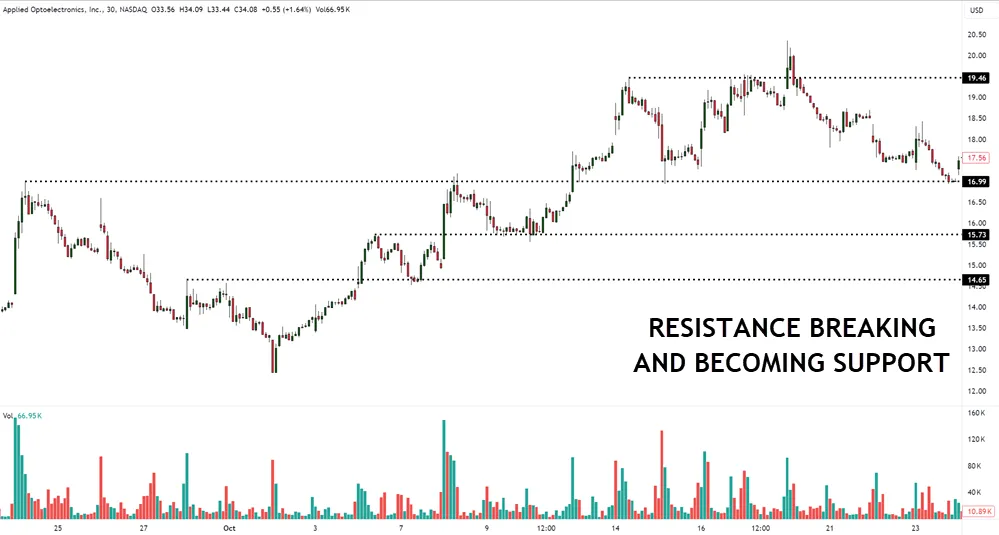
Strong prevailing trends and historical resistance levels acting as new support provide reliable signals for directional bias.
Looking for clear trends and potential reversals helps you identify whether buyers or sellers have control of the market.
When you combine these price patterns with volume analysis, you’ll get a stronger confirmation of the market’s true bias, as higher volume often validates the strength of a price movement.
Analyzing Price Movements — Understanding Trends and Reversals
Mastering price movement analysis starts with recognizing three key elements: higher highs and higher lows for uptrends, lower highs and lower lows for downtrends, and equal highs and lows for sideways markets.
By understanding these basic price structure dynamics, you’ll find it easier to spot trend continuation patterns and potential reversals in real-time.
When you’re analyzing market flow, pay attention to how price reacts at psychological support zones. These areas often trigger significant moves and can help you anticipate whether a trend will continue or reverse.
Watch for reversal candlestick formations at these key levels, as they’re indicators of potential trend changes.
Here’s what you should look for when analyzing price movements:
- Strong trends typically show clear price structure with consistent higher highs or lower lows
- Reversal signals often appear after extended moves and include multiple candlestick patterns
- Sideways markets usually indicate consolidation and require patience before making trading decisions
- Volume changes at key price levels can confirm the strength or weakness of a trend
Using Support and Resistance Levels
Building on price movement analysis, support and resistance levels offer powerful perspectives into market bias. You’ll find that these price barriers act as key indicators of where the market might turn, helping you spot potential trade opportunities.
To identify support level significance, watch where prices repeatedly bounce up from a specific price point. This shows buyers stepping in consistently.
Similarly, resistance level psychology reveals where sellers tend to take control, creating price ceilings. When you’re tracking these levels, focus on how prices react when they touch these barriers.
For reliable breakout confirmation strategies, look for prices that push decisively through support or resistance with increased volume. This often signals a strong bias in that direction.
You’ll also want to monitor intraday reversal patterns around these levels, as they can indicate when the bias might shift. Pay attention to gap analysis techniques, especially when prices open above resistance or below support – these gaps often hint at the day’s potential direction.
Applying Volume Analysis to Confirm Bias
During active trading hours, volume analysis is a tool for validating market bias. By monitoring trading volume alongside price movements, you’ll get a better picture of market participation and the strength behind price moves.
Higher intraday liquidity often signals stronger trend conviction, while lower volume might suggest weaker momentum.
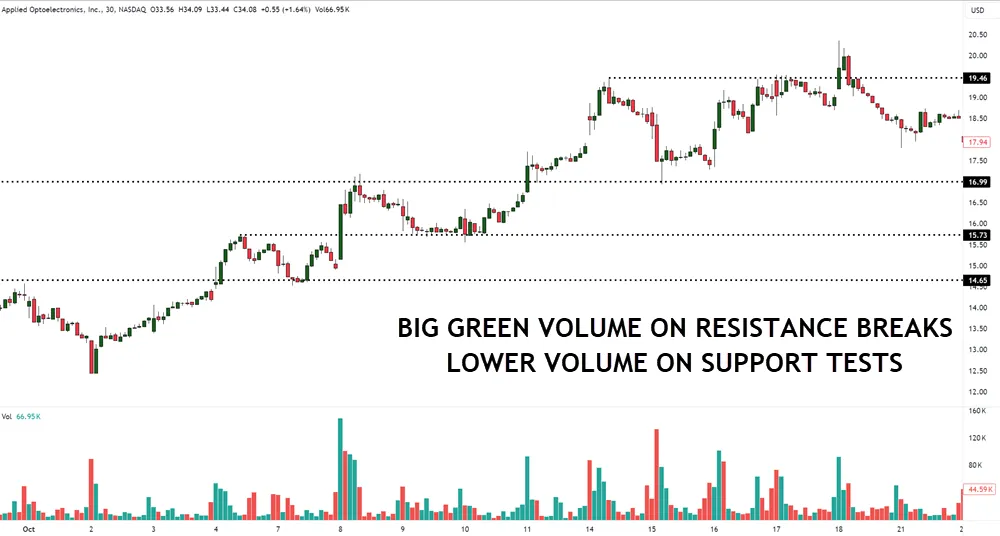
To effectively use volume analysis in confirming market bias, watch for these key patterns:
- Volume spikes during price breakouts typically confirm the move’s validity and suggest strong directional bias
- Declining volume during price advances can signal potential trend weakness and upcoming reversals
- Consistently high volume in the direction of the trend indicates healthy market participation
- Volume divergence from price action often warns of possible trend changes or false breakouts
When you’re analyzing volume patterns, focus on relative changes rather than absolute numbers. For example, if you notice trading volume increasing as prices move higher, it’s usually a sign of strong bullish bias.
If volume drops while prices climb, you might want to be cautious about the trend’s sustainability. This approach helps you make more informed decisions about market direction.
Developing a Price Action Trading Strategy
Once you’ve identified the market bias, you’ll need to create a solid trading plan that outlines your entry points, position sizes, and profit targets.
Candlestick pattern analysis and watching for high-probability setups like pin bars can help confirm your directional bias before entering trades.
Your strategy should include clear risk management rules, like setting stop-losses at key price levels and limiting your risk to a small percentage of your trading account.
You can strengthen your approach by backtesting your strategy against historical price data to see how it would have performed in different market conditions.
Creating a Trading Plan Based on Bias
A successful trading plan based on market bias requires three core components: entry rules, exit strategies, and position sizing guidelines. When you combine these elements with proper trade execution and trading psychology, you’ll be better equipped to navigate the markets effectively.
Check out the 9 EMA strategy based on trend bias and chart patterns.
Your trading plan should incorporate market sentiment and trend analysis to help you make informed decisions. Here’s what you’ll need to include in your plan:
- Clear entry criteria based on price action patterns and market bias confirmation
- Risk management rules that specify your maximum loss per trade and daily loss limits
- Specific exit strategies for both profitable and losing trades, including trailing stops
- Position sizing formulas that account for your account size and risk tolerance
Remember that your trading plan isn’t set in stone. You should review and adjust it regularly based on market conditions and your performance.
Start with small positions while you’re testing your plan, and don’t let emotions override your predetermined rules. Focus on consistency rather than trying to hit home runs with every trade.
Risk Management Techniques Specific to Intraday Trading
Effective risk management builds upon your trading plan by implementing specific safeguards for intraday trading. When you’re dealing with fast-moving markets, you need to have clear risk assessment strategies and position sizing methods in place before entering any trade.
| Risk Management Component | Implementation Strategy |
|---|---|
| Stop Loss Techniques | Set firm stops at key support/resistance levels |
| Position Sizing Methods | Never risk more than 1-2% of account per trade |
| Volatility Considerations | Adjust position size during high volatility |
| Trade Management Tactics | Scale out of positions at predetermined levels |
| Risk Assessment Strategies | Monitor market conditions before each entry |
Adapt your trade management tactics based on market conditions throughout the day. During volatile periods, consider reducing your position size and widening your stops to accommodate larger price swings.
It’s essential to maintain consistent risk parameters even when the market’s moving in your favor.
Remember that intraday trading requires quick decisions, so having predetermined stop loss techniques helps remove emotion from your trading. Always consider the current volatility levels when setting your risk parameters, and don’t hesitate to stay out of the market when conditions don’t meet your risk criteria.
Backtesting Your Strategy for Effectiveness
Through systematic backtesting, you’ll validate whether your price action trading strategy actually works before risking real capital.
Using historical data, you can simulate your trading approach and measure its effectiveness across different market conditions. This process helps you identify potential flaws and opportunities for strategy optimization before putting real money at stake.

When conducting your backtesting, focus on these key performance metrics:
- Win rate percentage and average profit per trade to understand your strategy’s consistency
- Maximum drawdown levels to assess risk management effectiveness
- Risk-to-reward ratios across different market conditions
- Time periods when your strategy performs best or worst
Your backtesting techniques should include both manual and automated simulation results.
Start with a recent three-month period, then expand to six months and a year to see how your strategy performs in varying market environments.
Document everything – your entries, exits, and the market conditions that influenced your decisions.
Advanced Techniques for Experienced Traders
While you’ve mastered the basics of price action trading, you’ll want to combine your chart reading skills with carefully chosen indicators like volume and momentum to confirm your bias signals.
Maintaining a 60-80% win rate through consistent analysis is recommended for long-term success in bias trading.
Your emotional state plays a role in bias trading, so you’ll need to develop strong mental discipline to avoid letting fear or greed cloud your judgment.
You can strengthen your approach by tracking market correlations and intermarket relationships, which often provide early clues about potential intraday direction changes.
Using Additional Indicators with Price Action
In accordance with advanced trading strategies, you can improve your price action analysis by combining it with select technical indicators. While price action remains your primary tool, carefully chosen indicators can confirm your market bias and enhance your trade management decisions.
When selecting indicators to complement your price action trading, focus on these key aspects:
- Volume indicators help validate price movements and show real market sentiment behind the trends you’re observing.
- Momentum oscillators can confirm whether your price action signals align with the overall market strength.
- Moving averages provide dynamic support and resistance levels that work well with price action patterns.
- Volatility indicators help you adjust your timing entries based on current market conditions.
Remember that indicator compatibility is important- you don’t want to overcomplicate your charts. Choose just one or two indicators that naturally complement your price action strategy.
For example, if you’re using support and resistance levels, a volume indicator can help confirm breakouts. This approach keeps your analysis clean while adding valuable confirmation to your trade decisions, refining your overall market bias assessment.
Emotional and Psychological Factors in Bias Trading
A trader’s psychological state plays a role in correctly identifying and trading market bias. Your emotional resilience and psychological discipline will determine how well you can spot and act on market trends without letting fear cloud your judgment.
| Emotional Factor | Impact on Bias Trading |
|---|---|
| Fear Management | Controls impulsive exits |
| Trading Mindset | Maintains objectivity |
| Self-Awareness | Prevents overtrading |
| Decision Making | Reduces analysis paralysis |
| Risk Tolerance | Enables confident execution |
You’ll need to develop strong fear management skills to avoid letting emotions override your analysis. When you’re working with price action, your decision making biases can either support or sabotage your trading results. It’s essential to maintain a clear trader mindset by staying focused on your predetermined strategy rather than reacting to market noise.
Remember that your psychological discipline will be tested most when the market moves against your position. That’s when you’ll need to rely on your emotional resilience to stick to your analysis rather than abandoning your bias prematurely.
Practice self-awareness to recognize when your emotions are affecting your interpretation of price action signals.
Your Questions Answered
How Long Should I Wait Before Confirming an Intraday Market Bias?
You should wait for at least the first 30 minutes of trading to confirm an intraday market bias, as early price action can be volatile and misleading.
Watch for clear confirmation signals like higher highs or lower lows to develop.
Your waiting periods shouldn’t be too long, as you’ll miss opportunities, but don’t rush – good trader psychology means being patient.
Always prioritize risk management and wait for reliable price patterns before committing to trades.
Can Market Bias Change Multiple Times During Premarket Trading Hours?
Yes, you’ll notice that market bias can shift multiple times during premarket hours.
These changes often occur due to varying premarket trends and heightened volatility analysis.
You’ll want to watch how prices interact with key support levels and resistance zones, as these can trigger bias shifts.
Market sentiment can quickly change with news releases or institutional activity before the regular session.
It’s essential to stay flexible with your bias assessment during this time.
Which Timeframe Charts Work Best for Identifying Intraday Market Bias?
You’ll want to focus on multiple timeframes to identify intraday market bias effectively.
Start with a 15-minute chart to spot short term trends and key support and resistance zones.
Then, compare it with 5-minute charts for detailed candlestick patterns and immediate price action.
For broader context, check the 1-hour timeframe.
This timeframe comparison helps you understand how smaller moves fit into the bigger market picture.
Does High Trading Volume Always Confirm the Current Market Bias?
No, high trading volume doesn’t always confirm your market bias. While volume interpretation is important, you’ll need to consider how it aligns with price levels and market movement.
Sometimes, high volume can actually signal a reversal rather than confirming the trend. You should combine volume analysis with other factors like sentiment analysis and order flow to get a complete picture.
Think of volume as just one piece of your trading puzzle.
Should I Adjust My Bias Analysis During Economic News Releases?
Yes, you should definitely adjust your bias analysis during economic news releases.
Your trading strategies need to account for increased news volatility, which can quickly shift market sentiment.
Don’t rely too heavily on economic predictions, as breaking news can rapidly change the market’s direction.
It’s smart to wait for the market to settle and show clear bias consistency before making trading decisions.
Consider stepping aside during major news events to avoid unpredictable price swings.
Conclusion
Finding intraday market bias doesn’t have to be complex. You’ll improve your trading success by mastering price action patterns and understanding support and resistance levels. Pay attention to how prices move throughout the day, and don’t forget to confirm your bias with volume analysis. When you combine these techniques with disciplined practice, you’ll naturally develop the ability to spot market direction and make smarter trading decisions.

