- April 5, 2021
- Posted by: CoachShane
- Category: Trading Article

The Accumulation Distribution Line by Marc Chaikin is a volume based indicator that uses volume as part of its calculation to determine the price trend.
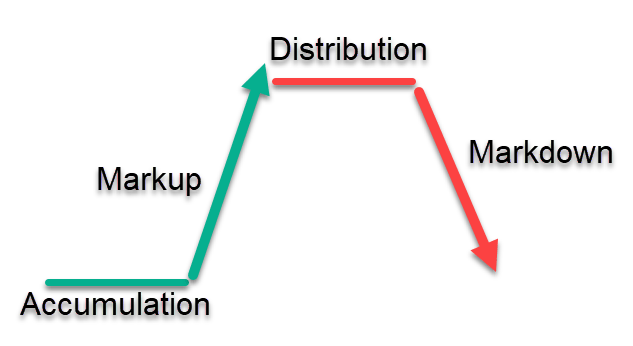
The terms “accumulation and distribution” are often used to describe the up and down movements in price:
- Accumulation is when traders are buying stocks at a rate that will not drive the price up too much
- Markup is when more buyers are stepping in when they start to see upwards movement in the stock price
- Distribution is where early buyers begin to unload their positions (selling) at a rate that won’t cause a drastic price drop
- Markdown is where the masses begin to see the stock falling and they sell out of their positions
The Accumulation Distribution Line is designed to give you an easy view of the first and third market state which will help a trader choose their trading direction.
So how does the A/D line do that?
Accumulation/Distribution Line Calculation Explained
When using volume, you are able to see the level of interest that traders have in terms of buying and selling when comparing it to price.
Since volume precedes price movement, the number of shares being bought and sold is comparable to the rise and fall of the line.
- High volume of shares bought – fast rising prices
- Lower volume of shares bought – slower rising prices
The formula requires several calculations:
Money flow multiplier: [(Close – Low) – (High – Close)] /(High – Low)
If that calculation is positive, we have more buying pressure than selling pressure during that period.
With that calculation giving us the direction of money flow, we head to the next one:
Money Flow Volume = Money Flow Multiplier x Volume for the period
Here we have taken the first calculation and multiplied it by the volume for that period to give us MFV (money flow volume)
Finally, we can complete the calculation that will determine the state of the A/D line via buying and selling pressure:
Previous A/D number + Current period’s Money Flow Volume
Notice we use the previous reading to get the current reading which shows the cumulative feature of this indicator. This will allow us to see any sustained trend and direction in the stock.
How Does The Accumulation/Distribution (A/D) Indicator Work?
Knowing the calculation is one thing but you need to apply it to understand what the chart is showing you.
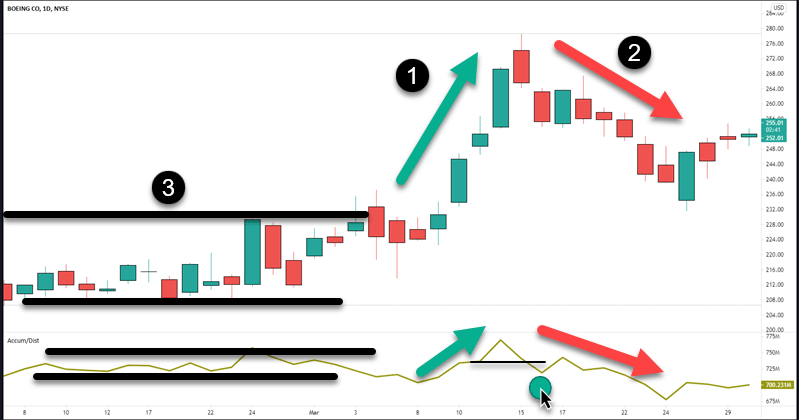
This is a daily stock chart of Boeing:
- The A/D is moving up as is price and any low in the indicator comes before a new high. We expect the move up to continue with strong buying pressure
- The indicator is moving down and putting in lower highs and lows. We would expect the down move to continue due to stronger selling pressure
- We have sideways price action and sideways indictor with no large jumps. Consider a range trading strategy
Note when price starts breaking down, our indicator breaks a previous low which signals stronger selling pressure and the current trend being down.
Using the Money flow multiplier number:
- If the closing price is above the midpoint of the high-low range, the number is positive and suggests more buying than selling pressure
- If the closing price is below the midpoint, the number would be negative and more selling pressure
Calculating the values from yesterday and today, will give you price trend. Sharp moves in the indicator will show you if the move has potential to continue in that direction.
Does It Show Divergence?
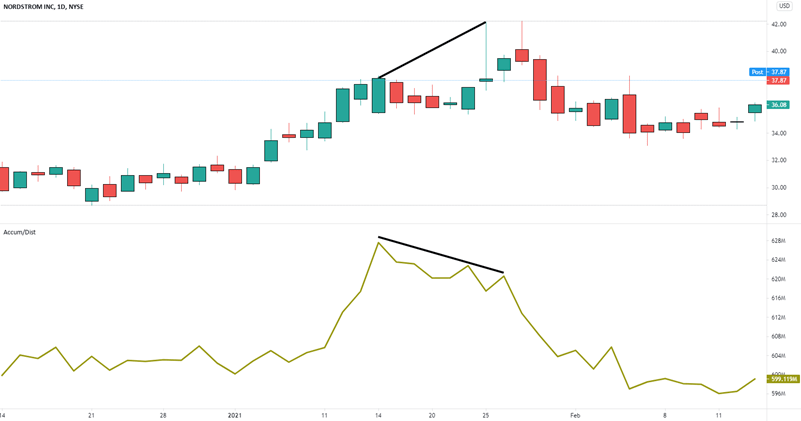
Divergence is price going one way and the trading indicator going another.
The price on this daily price chart is rising and making new highs. This generally indicates a bullish trend.
- If the stock price is rising and accumulation distribution line is falling, we have bearish divergence
- A falling stock price and a rising accumulation distribution line would be bullish divergence
Does that show potential price changes?
Potential is the key word which is why divergence is not a trading signal to open/close a position by itself.
If you are holding long and bearish divergence shows up, you would either tighten stop or upon the breakdown, sell out of your positions if price action was against you.
It’s a warning sign that the interest in higher prices is not showing up in the volume and also that price is closing close to lows than highs.
Advantages and Disadvantages of A/D Indicator
The accumulation distribution indicator is a quick visual of the volume behind your current price move compared to previous periods. Using volume with price moves is a popular method of analyzing a price chart. When analyzing, seeing divergence by using the indicator compared to price, you may keep yourself out of trade entries that go quickly against you.
The advantage is also a disadvantage if you are a Forex trader. Since there is no centralized FX exchange, you are not using true market volume readings. For those traders, consider charting the currency futures and taking your position in the retail market.
It’s not a stand-alone trading indicator giving buy and sell signals. You still need a reason to enter such as a price pattern and a trade entry trigger to enter the trade.
You can download your free price pattern guide that you could pair with your use of this indicator.


