- February 1, 2024
- Posted by: CoachShane
- Categories: Trading Article, Trading Indicators

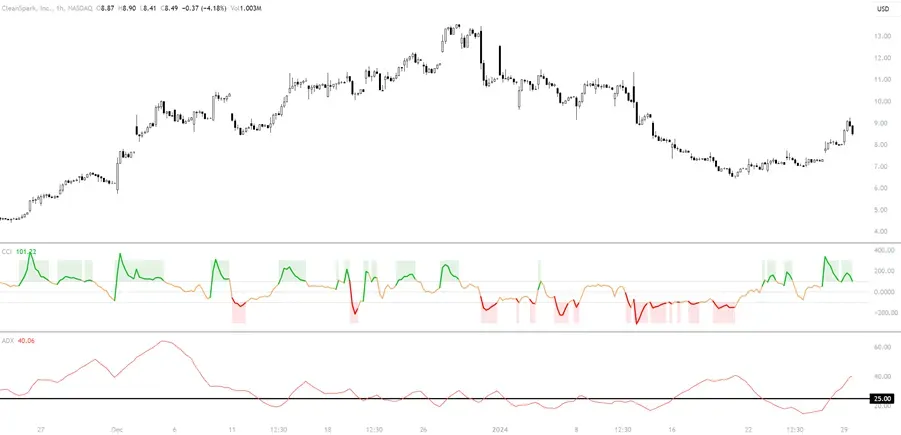
Accurately gauging market momentum is key, and that’s where tools like the Average Directional Index (ADX) and the Commodity Channel Index (CCI) come into play. The ADX helps traders understand the strength of a trend by providing a numerical value, making it easier to tell if a market move is strong or weak. The CCI tracks how current prices stack up against an average over a set period, helping to spot price deviations.

TLDR: The question of the ADX VS CCI winner depends on various factors including your trading strategy and market conditions. ADX is valuable for gauging the strength of a trend, while CCI excels in identifying overbought or oversold conditions for precise timing of trades. Pick the one that suits your style and consider using both or alongside other indicators for a well-rounded analysis.
Comparing ADX and CCI: Choosing the Right Tool
 Choosing the right tool can make a big difference in your trading strategy. Which one is better for catching and profiting from market momentum? To determine this, we need to look at how they work in actual trading scenarios and understand their pros and cons.
The ADX is great for confirming whether there’s a trend worth following. It doesn’t tell you the direction of the trend, but it does show how strong it is. A high ADX value suggests a strong trend, while a low value might indicate a weaker trend or market range. This could be helpful when you want to hold onto a trade during a strong trend for larger profits, rather than getting out too early.
Choosing The CCI
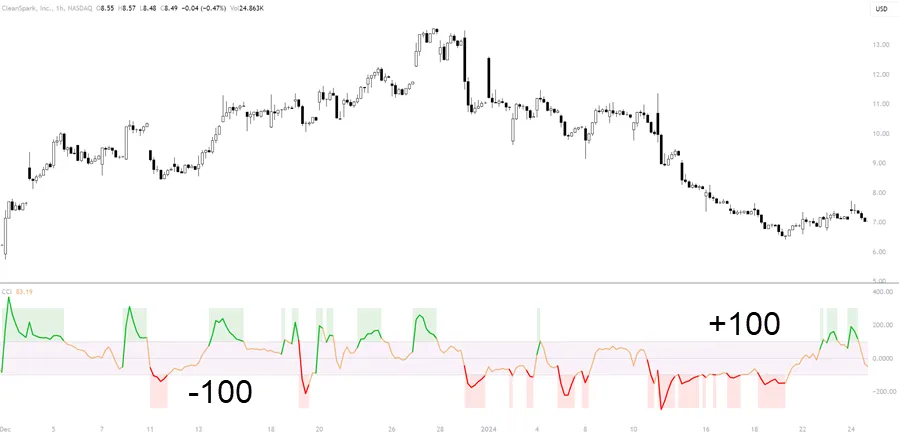
On the flip side, the CCI is more about timing. It tells you when prices are high or low compared to the average, which can signal buying or selling opportunities. For example, if the CCI shows a value above +100, it might mean the price is unusually high and could soon be corrected. Conversely, a value below -100 might suggest the price is unusually low and could bounce back.
Traders need to think about their trading style and what they’re trying to achieve. If you’re looking for a strong trend to ride, the ADX might be your go-to. But if you’re after precise entry and exit points based on price extremes, you might prefer the CCI.
Remember, no tool is perfect. Both the ADX and CCI can give false signals, especially in volatile markets. It’s often a smart move to use them together or with other indicators to confirm their signals. This way, you have a more rounded view of the market, which can help in making better-informed trading decisions.
ADX: Basics and Application
When you study the Average Directional Index (ADX) you can see its role in measuring market trends. Created by J. Welles Wilder, this tool is part of a larger system that includes the Positive Directional Indicator (+DI) and Negative Directional Indicator (-DI). Its primary function is to assess how strong a trend is by using a moving average based on the range of price changes within a given timeframe.

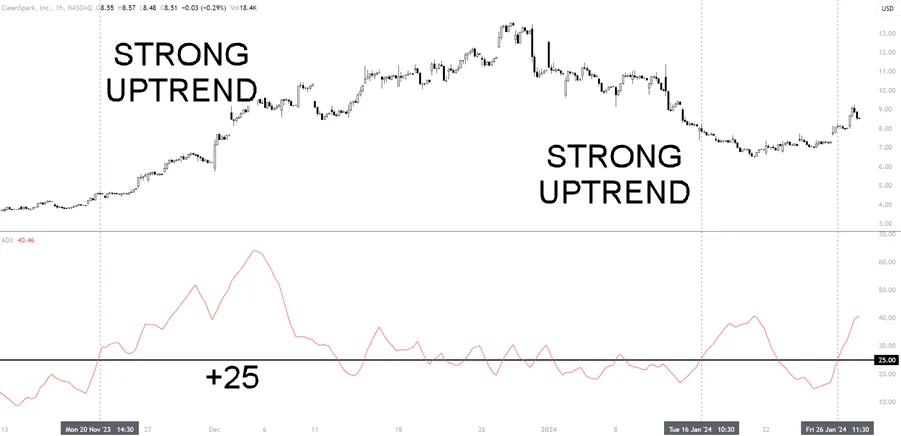
The ADX is usually displayed as one line, and its value can be anywhere from 0 to 100. When the ADX value is over 25, it typically means there’s a strong trend present. On the other hand, a value under 20 often signals a weak trend or the absence of one. The ADX is neutral concerning direction; it only measures the trend’s strength.
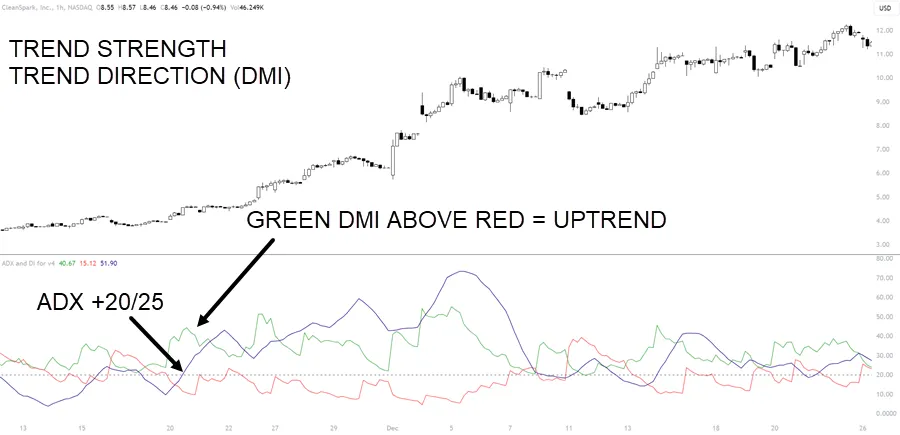
For practical use, the ADX is combined with the +DI and -DI to figure out the trend’s direction. If the +DI is above the -DI, it suggests an uptrend in the market. If it’s the other way around, with the -DI above the +DI, then a downtrend is likely.
Understanding how to use the ADX can help traders decide when to trade with a trend or when to stay out during times when the market is stable and not showing clear movement.
Market Trends With ADX
 Here’s a straightforward way to understand ADX readings:
- Trend Strength: An ADX value higher than 25 is generally seen as indicative of a strong trend. In contrast, a reading below 20 often means the trend is weak or might not even be present.
- Directional Movement: The ADX is accompanied by two other indicators: the Positive Directional Indicator (+DI) and the Negative Directional Indicator (-DI). When +DI crosses above -DI, it suggests that buyers are gaining control, signaling a bullish trend. On the other hand, if -DI crosses above +DI, it suggests a bearish sentiment.
- Trend Quality: If the ADX is on the rise, it typically means the current trend, whether upward or downward, is getting stronger. If the ADX is falling, the trend might be losing its momentum.
- ADX Peak/Trough Analysis: Paying attention to the highs and lows in the ADX can provide hints about possible changes in the trend. A high point in the ADX could mean the trend is about to slow down or reverse, while a low point could suggest that a trend is about to strengthen.
CCI: Basics and Application
The Commodity Channel Index (CCI) is a tool traders use to spot when trends might be reaching a point of exhaustion. Created by Donald Lambert, the CCI calculates how much a security’s price has deviated from its average value. When the CCI shows high readings, it suggests that prices are significantly higher than average, hinting at a strong uptrend.
On the flip side, low CCI readings can imply that prices are much lower than average, potentially indicating a downtrend.
 To use the CCI effectively, traders watch for the index to cross above +100 or dip below -100. These levels can signal overbought or oversold conditions. It does mean you simply take a trade based on the reading since it’s not always predictive. For instance, in a strong uptrend, the market can remain overbought for a considerable period, and the same goes for oversold conditions during a downtrend. Therefore, it’s wise to use the CCI alongside other indicators.
When incorporating the CCI into your trading approach, it’s a good idea to use it with additional market indicators. If the CCI rises above +100, you might consider this a cue to think about buying. But it’s smart to wait for further proof, like a price chart breakout or bullish patterns, before making a trade. If the CCI falls below -100, it could be a hint to consider selling, but confirming this with other bearish signals can make your trade decision more reliable.
Pros and Cons of These Indicators
ADX Pros:
- Clear Trend Strength Indicator: ADX measures the strength of a trend, helping traders determine if a trend is strong or weak.
- Useful in Various Market Conditions: It can be applied in both trending and range-bound markets to identify potential breakout points.
- Enhances Trend-Based Strategies: ADX is valuable for traders who rely on trend-following strategies.
ADX Cons:
- Lagging Indicator: ADX is based on moving averages, so it provides delayed signals.
- Does Not Indicate Trend Direction: While it shows strength, it doesn’t specify if the trend is upward or downward.
- Complex for Beginners: Understanding and interpreting ADX can be challenging for new traders.
CCI Pros:
- Identifies Overbought/Oversold Conditions: CCI is excellent at highlighting when assets are potentially overbought or oversold.
- Timely Entry and Exit Signals: It can provide early signals for traders to enter or exit trades, based on deviation from the average price.
- Flexibility Across Markets: CCI can be used in different markets like stocks, forex, and commodities.
CCI Cons:
- Prone to False Signals: CCI can sometimes give false signals, particularly in volatile markets.
- Requires Additional Confirmation: Traders often need to use other indicators or analysis methods to confirm CCI signals.
- Sensitive to Market Changes: Due to its sensitivity, it can react aggressively to short-term market changes, leading to overreaction.
Which One Is Better?
The ADX and CCI indicators both offer unique advantages for measuring market momentum. ADX is good at identifying the strength of a trend, which is important for trend-following strategies. It allows traders to gauge whether a trend is worth getting involved in.
The CCI focuses on price deviations from the average, highlighting overbought or oversold conditions. This makes it particularly useful for timing trades in fluctuating markets. Depending on your trading objectives, you might prefer ADX for its clarity on market trends or CCI for its ability to time trades effectively. Both tools, when used properly, can significantly enhance market analysis.
FAQ
Which momentum indicator is considered the most accurate?
The accuracy of a momentum indicator depends on the trader’s strategy and market conditions. No single indicator is universally the most accurate.
How do CCI and ADX differ?
CCI identifies overbought or oversold conditions by measuring price distance from the mean, while ADX gauges the strength of a trend without specifying its direction (unless using the DMI lines).
Which indicator pairs well with ADX?
The RSI (Relative Strength Index) or MACD (Moving Average Convergence Divergence) often complements ADX well, providing additional insights into market momentum.
What’s an effective momentum reversal indicator?
The Stochastic Oscillator is widely regarded as a reliable momentum reversal indicator, particularly useful for identifying potential trend reversals.

