Tushar Chande brought the trading world the Aroon Indicator in 1995, and it is used to gauge the direction and the strength of the trend on any time period.
It is a two line oscillator, Aroon Up and Aroon down, that is bounded by the 0% level and the 100% level.
This article will show you the formula behind the Aroon indicator calculation and how the output can aid you in your trading.
How The Aroon Indicator Is Calculated
When a market is trending either up or down, there will be times that the market moves strongly in that direction.
- A strong bullish market can see new highs
- A strong bearish market can see new lows
New highs and lows is important to the calculation and the formula for the Aroon is:
Aroon Up: (14 periods – how many days since last high during the 14 period lookback) X 100/14
Aroon Down: (14 periods – how many days since last low during the 14 period lookback) X 100/14
What does that mean?
We Can Now Determine Strength Or Weakness
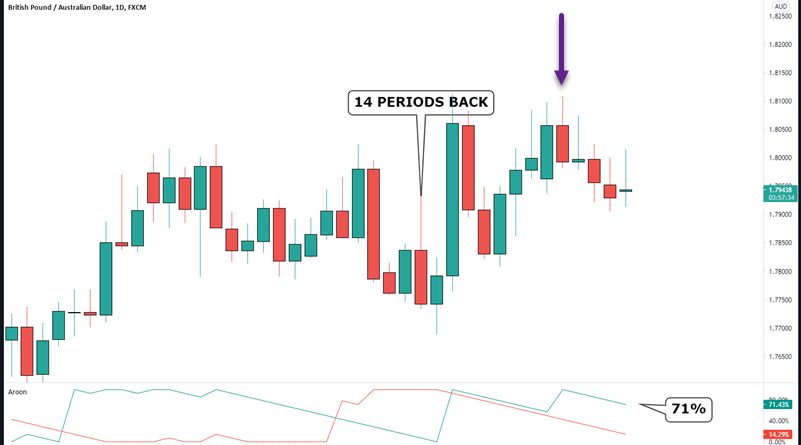
If the period is set to 14, the calculation will look back through the last 14 bars to find the highest high
In the chart example, 4 bars from the right was the highest high in that period (the last day was still forming)
The Calculation Will Then Be: (14-4)X100/14 = 71%
You determine the strength of the trend by comparing the current reading by readings in the past.
In our example, you can see the Aroon up (green line) is moving downwards showing a decrease in the bullish strength of this instrument. The indicator, while price was at highs before the move down showed, extreme strength of 100% – a strong move.
Essentially, we are seeing how long it’s been since a new high was made during the lookback period. When price pulls away from the high, you will see the Aroon percentage decrease.
Ideally, we will see the Up line close to 100 and the Down line closer to 0 to signify strength in the market. That would simply mean that over the last 14 periods, we are currently close to the last highest high and further from the last lowest low meaning we have a strong uptrend.
You can edit the lookback period and the general settings used are 14 and 25.
As with most indicators, a shorter lookback will give more volatile readings while a higher reading will smooth out the indicator.
Bullish Or Bearish Trend Bias?
Another feature of the indicator is the ability to give you, at a glance, the general direction of price.
To do so, we just compare the Aroon Up with the Aroon down to determine price direction.
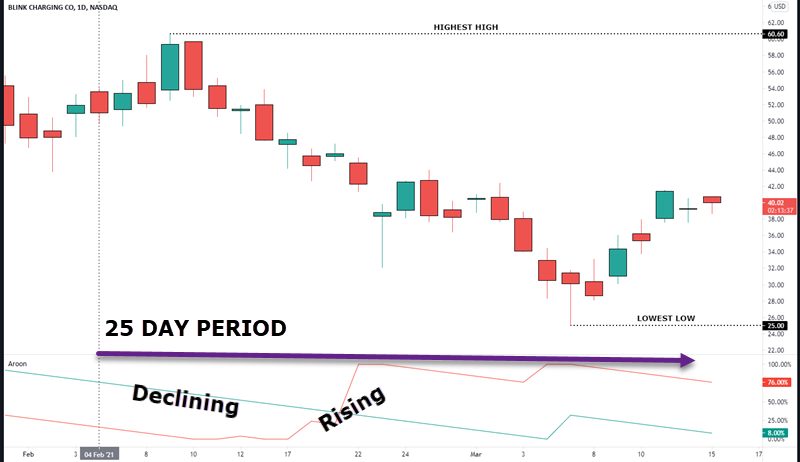
We will use the 25 period setting and you can see:
- Price moves further from the last high, the green line heads down towards 0% indicating a weakening of bullish strength
- As price is closer to the last low, the red line rises towards 100% indicting price is making new lows which is bearish strength
- Once the lines cross with red over green, you can consider a down trend is now in force.
How do you use that information?
How Do You Use The Aroon Indicator In A Trading Strategy?
You have learned you can determine the trend with the crossing of the lines as well as the strength/weakness of that trend as the lines pull towards 100%/0%.
Putting that information together into something actionable is going to depend on the trader.
I want to say that trading the crossovers as trading signals, when to enter and exit a trade, is not the best way to use the Aroon. You will want to apply other technical analysis techniques instead of trading the crosses blindly.
Are You A Trend Trader?
While I would never buy/sell on a crossover alone, traders can use the trend feature of the indicator to pick a side.
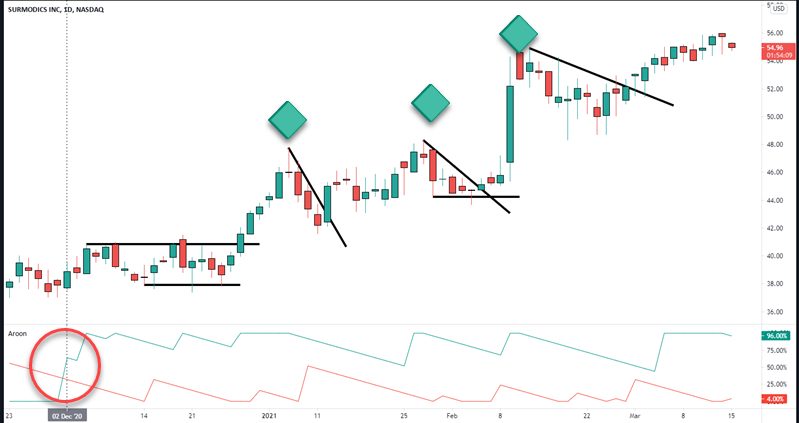
The red circle shows where the uptrend begins so traders would only look for long trades.
We have a trading range breakout that leads to a move up in price. The green diamonds are where the Aroon indicator hit 100% which means these are new highs and a strong uptrend.
As long as the Aroon keeps hitting 100%, trend traders can look to trade the reversals out of the pullback. When trading pullbacks, we need to see strength in the impulse move prior to the correction to ensure there is potential for another leg up. You can learn more about trading pullbacks here.
Are You Into Trading Ranges?
Price moves in waves and in-between waves, we can see price consolidate.
We can see a ranging market objectively by using the up and down lines of the indicator. We want to see the lines moving together in the same direction as price and that is easily seen on the chart below.
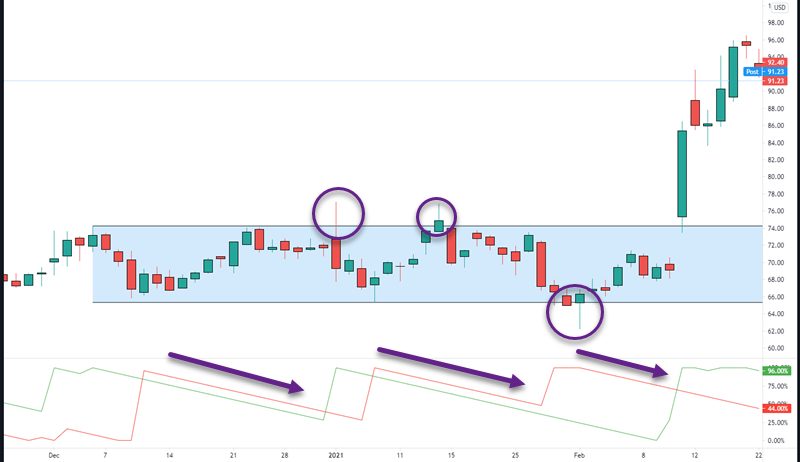
You can see via the arrows that the lines are heading in the same direction, towards zero in this example, indicating a range as there are no new higher highs/lower lows. We do see, prior to the last arrow, a new low behind made which caused the red line to spike upwards.
How to trade those probes above and below the range extremes? Learn how to trade ranges in this trading article.
Trends Exhaust. Will You Trade The Price Reversal?
You know that the indicator will measure strong and weak trends.
Strong trends, especially momentum fueled ones with large candle bodies, run the risk of exhaustion as price makes new highs.
We can look for trend termination types of trades when we see the price chart showing, along with the Aroon, the possibility of at least a short term correction.
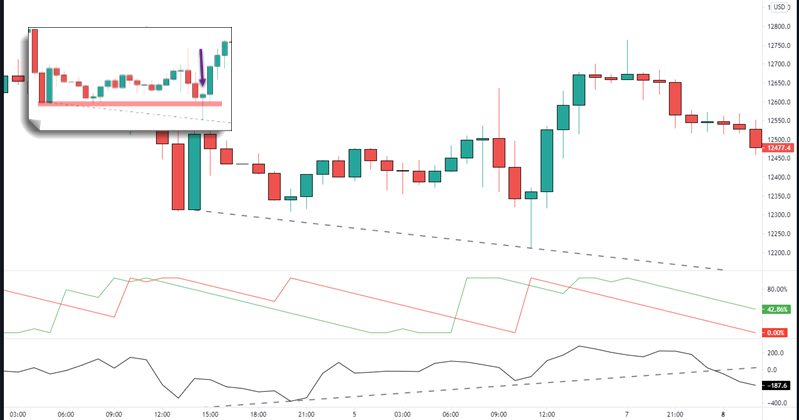
I applied the 10 period momentum indicator in the bottom pane of this chart where price had been moving steadily down for a month.
Price made a lower low while the red Aroon was at 100% which we know means strength to the downside.
The momentum indicator made a higher low at the same time price made a lower low. We have price divergence.
The inset chart shows where you would place your order to go long on this trade.
Let’s look at another example in Bitcoin on this day:
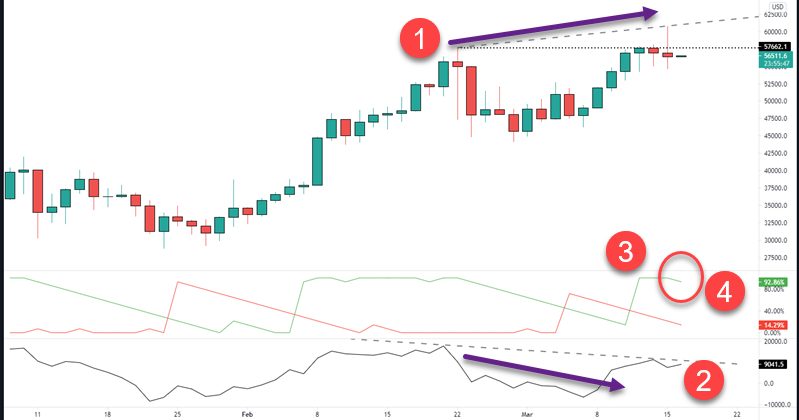
Breaking the important things down:
- Price has put in a higher high
- Momentum did not put in a higher high
- Aroon indicator is 100%
- We are starting to see Aroon travel in the same direction as the down line (red). This points to a possible range forming.
Using this information, traders may be on alert to:
- Trade a possible range formation
- Using a range breakout to enter a long
- Look for price to pullback for another entry
- Tighten up stops to look in any profits (if you actively trade it)
There are plenty of options for a trader which is why having a toolbox of trading strategies you can use is not a bad thing.
Aroon Oscillator – Key Takeaways
To wrap up, here are the key things you should remember:
- When the Aroon Down is above the Aroon Up, it shows bearish price action
- When Aroon Up is above Aroon Down, it shows bullish price action
- The crossing of the up/down lines can show you a change in trend has taken place
- An up line measures the number of periods since a High
- A down line which measures the number of periods since a Low
It’s a tool and by itself is not a trading strategy.
Implementing price action, trade trigger and exit points along with risk protocols along with the indicator can make for a viable trading strategy.
