- January 15, 2019
- Posted by: CoachShane
- Category: Trading Article

The ascending triangle pattern is one of my favorite chart patterns to look for in a bullish chart scenario.
It is one of the classical charting patterns that has been around for decades, much like the head and shoulder chart pattern, and maybe it has stood the test of time.
Why?
Because the ascending triangle, when looked at in the context of market action, makes sense especially when it’s a continuation pattern.
Ascending Triangle Pattern Breakdown
Why does the ascending triangle makes sense as a bullish chart pattern?
Let’s look at what the pattern is in an up trending market: a series of higher highs and higher lows.

Traders are buying at higher price in an uptrend with the expectation, however decided, that price will continue to go higher.
In the ascending triangle however:
- Price makes higher lows as shown by a rising trend line on lows
- Price makes similar swing highs forming a resistance line or zone
- Higher lows show smaller corrective declines which shows lack of downside interest
Why would traders buy at higher prices when price is not making new highs? There is an expectation that price will eventually go higher with an upside breakout.
That is the power of the ascending triangle chart pattern.
- Traders are expecting more upside and have no problem buying at higher price
- The resistance level shows there are some who will still sell at this zone but the higher lows show they are becoming less involved to the downside
- There may be stop accumulating above the resistance zone for those who are shorting. We could also be seeing longs exiting positions at the resistance line as a risk control measure
The coiled up buying pressure and the sudden realization from sellers that an eventual break upside is the intended direction, and they bail out on shorting or selling at the price zone shown by the resistance line.
That said, nothing is 100% in trading and the breakout to the upside can fail.
Trading The Ascending Triangle
There are a few ways you can trading this triangle pattern and I will show you my favorite use of it.
First though, let’s look at some common trading strategies around the ascending triangle
Trading The Breakout – Stop Order
I wanted to show that these patterns are not always as picture perfect as you saw in the earlier graphic. The concept here is the same:
- Common price zone for the highs
- Higher lows into resistance

Anticipating the breakout, traders can place a buy stop order just over the top of the resistance area. The main issue with this method is that markets do have failure tests which is simply price probing highs and then falling back.
With a failure test (commonly known as a bull trap), you’d find yourself triggered into the trade and almost immediately under water with the trade because of a false breakout.
Enter On Confirmation – Close
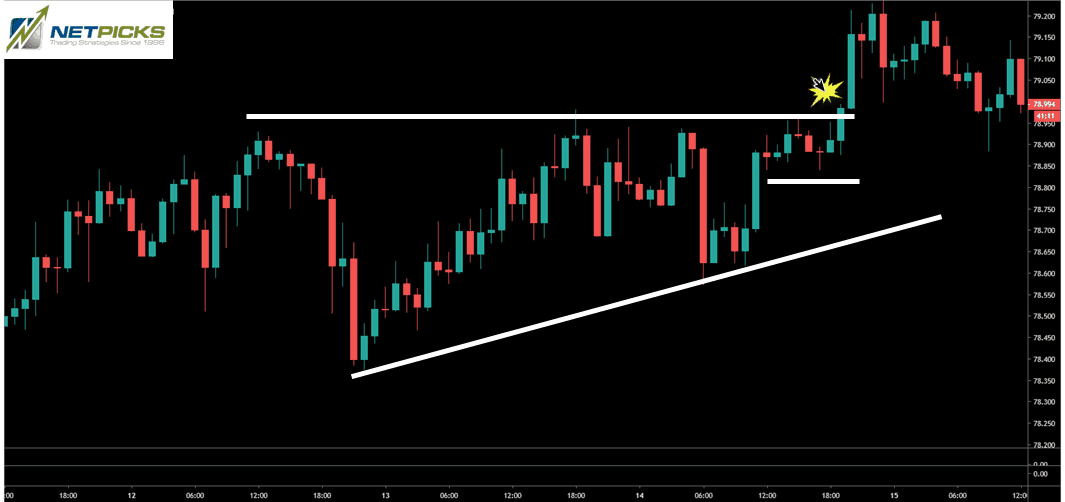
Another way to enter a long trade with the ascending triangle is to monitor the resistance level and enter on the close of the breakout candle or bar.

Another “not perfect” formation but the concepts, especially where the small horizontal line is, are intact.
Enter at market on the close of the candlestick if it stays above the breakout point as this one did.
The issue is if the breakout candlestick was the next one, the momentum candlestick, which could lead to a snap back in price soon after you enter. Depending on your stop loss position, the risk and position sizing on that trade may not be worth the reward.
Wait For Breakout Point Test
This method would have the breakout occur, price action above the breakout point, and a test of the breakout location to confirm the breakout will hold.
The breakout/pullback is a common trading pattern that is used from horizontal range price pattern breakouts.

You can see these patterns do take time to develop. As mentioned earlier, the concept matters and although I am using a bigger picture resistance line, you can see one forming lower.
You would allow price to breakout and pull back to the resistance line. You would enter your trade in that zone.
The biggest issue is that price could take off and not pull back to the breakout origin.
One thing to keep in mind with pullbacks, price can come back into the pre-breakout zone and not violate the breakout itself. I will cover that later.
My Favorite Ascending Triangle Strategy
I find the most use with this pattern is positioning before the breakout occurs.
In doing so, you get the benefit of instant positive feedback if momentum develops after the breakout.
Important points
- I am not looking for the ascending triangle pattern first
- A horizontal range is needed
- I can use lower time frames for price action

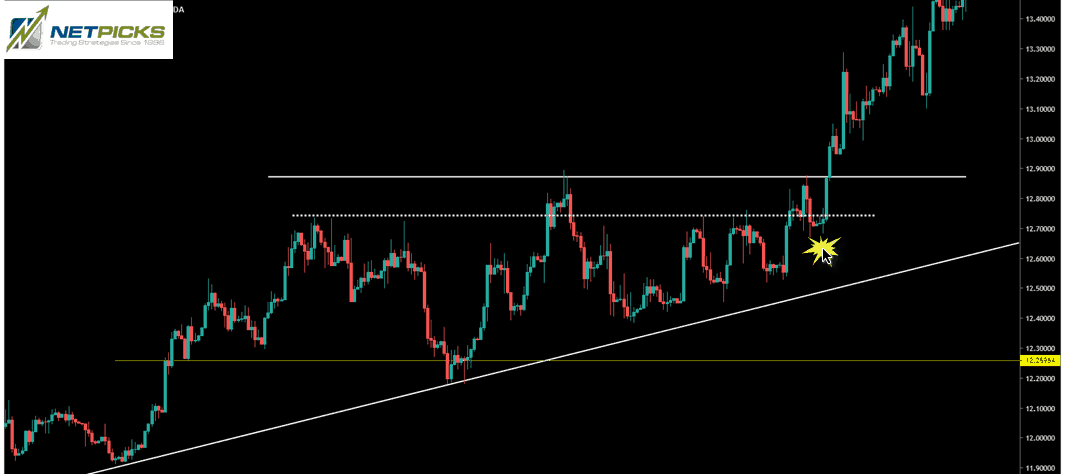
This is a lower time frame chart however the range was found on the daily chart as noted by the top white line and bottom yellow line.
The dashed line is a secondary resistance zone where the break above in the middle, was just an expansion of the range.
The yellow splash is the area to notice.
- Price formed a bigger picture range
- Smaller time frames highlights the ascending triangle pattern
- Basing under resistance is bullish
- Traders enter their position in the basing zone
What we have done is position ourselves before the breakout using a structure that is considered to be bullish.
A more idealized pattern for the range, ascending triangle, and basing is in this graphic.

The concept is clear:
- Buyers stepping in at higher prices
- Sellers and are unable to push price away from resistance – their entry point – to get positive feedback on their trades. That is the basing
- We are looking for the capitulation of sellers to drive our trade through resistance and hopefully engage breakout traders
Does it work all the time?
No.
What we have done is put probabilities of one thing happening over another in our favor. We just have to manage risk and ensure we place our stop loss.
Stop Loss Locations
You will never place a perfect stop loss and my choice for stop loss is using the average true range.
However, some traders will want to use some type of structure based stop which also is a good way to limit your risk on a trade.

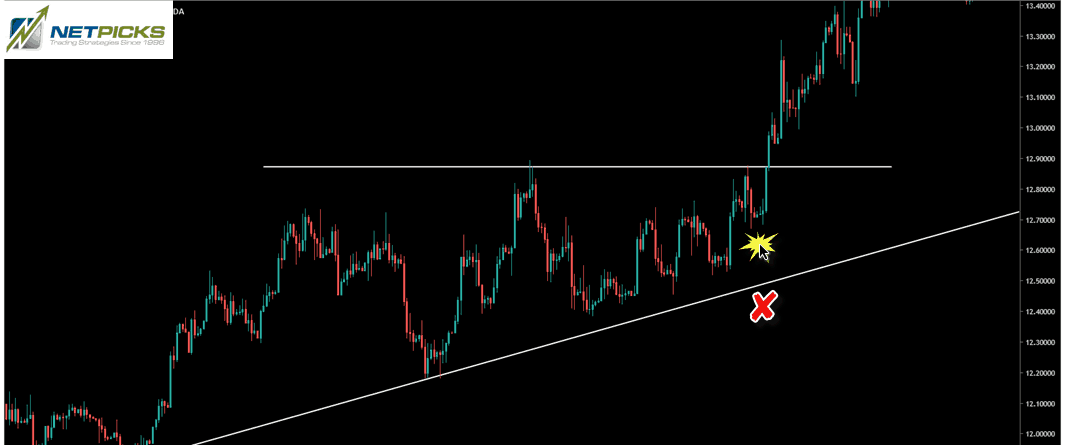
Some people will say to put the stop under the rising trendline at X. Does this make any sense?
- Larger stop loss in distance
- Price breaks multiple structures if it breaks down
- Trend lines can be drawn several different ways
Why does the yellow splash zone makes more sense?
- Respects structure – a support zone
- Price pulling back inside resistance does not invalidate the breakout – this level being violated does
- No need to let a trade run so far against you
Whatever you choose for stops, just be consistent with every trade.
Take Profits
Like stops, there are several ways to take your trading profit once the ascending triangle resistance is violated.
- Multiples of your risk – 1R, 2R, 3R
- Trailing stops – several variations
- Pattern based targets – let’s explain those
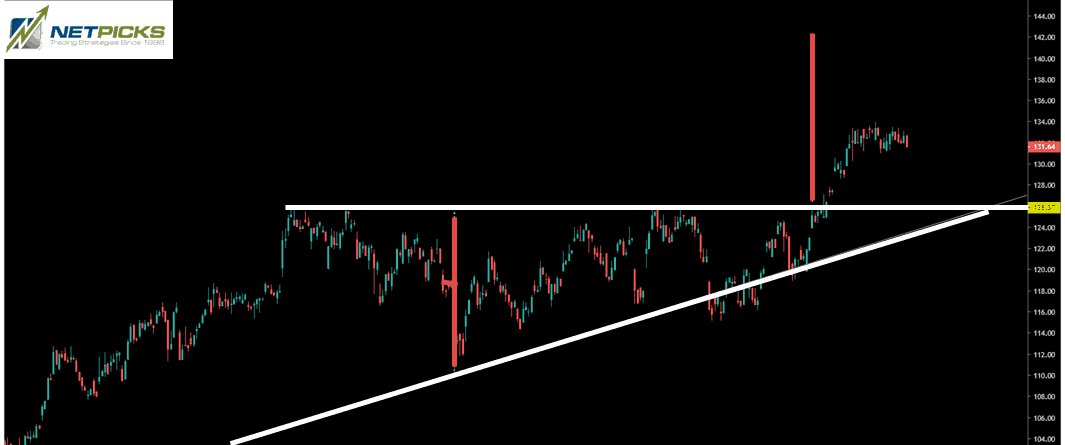
A pattern based profit target uses the height of the pattern projected from the breakout point.

How do you calculate the take profit target?
- Measure the height of the ascending triangle from the resistance line to the lowest low that forms the uptrend after the first resistance point
- Take the height and project from the breakout point
- Use the full target or scale out at 50% and move stop to break even
Like our stop loss, whatever you choose to use as your strategy for ascending triangles, please be consistent.
Wrap Up
I find the ascending triangle on lower time frames inside of a higher time frame rectangle range to be useful. This allows you to be involved in a position prior to the breakout which can lead to explosive trading profits.
Like all chart patterns, the concept matters and not a picture perfect pattern. Close is close enough as you can see in the last chart I posted.
Finally, whatever approach you use, consistency with the right things matter. Get that right, and success has an easier time to follow.

