- August 20, 2024
- Posted by: Shane Daly
- Categories: Day Trading, Trading Article

You’ve likely grappled with the challenge of selecting ideal time frames for your analysis as a day trader. It’s a decision that can significantly impact your trading performance and profitability. While there isn’t a one-size-fits-all solution, understanding the strengths and weaknesses of different time frames can give you a competitive edge.

From the fast-paced one-minute charts to the broader perspective of hourly timeframes, each offers unique insights into market behavior. But how do you know which ones are right for your trading style?
Zero-DTE options: the latest addition to your day trading arsenal. Professional traders are flocking to this market, making some staggering profits. Grab your complimentary “Zero-DTE Options Trading Secrets” report today and unlock new day trading potential!
Main Points
- One-minute charts are ideal for scalping, offering granular price action for quick trades lasting seconds to minutes.
- Five-minute charts balance detail and noise, useful for identifying short-term trends and intraday support/resistance levels.
- Fifteen-minute charts provide a broader perspective on intraday patterns and are key for trend identification.
- Hourly charts offer context for significant support/resistance levels and pivot points in day trading.
- Multiple time frame analysis combines longer frames for trend identification and shorter frames for precise entry/exit signals.
Understanding Time Frame Basics
Three key elements form the foundation of understanding time frames in day trading: chart intervals, trading sessions, and market volatility.
| Factor | Description | Importance |
|---|---|---|
| Chart Intervals | Range from tick-by-tick to daily | Provides varying levels of detail; select based on trading style and objectives |
| Trading Sessions | Pre-market, regular market hours, after-hours | Each presents unique opportunities and challenges; vital for optimizing strategy |
| Market Volatility | Fluctuates throughout the day | Impacts time frame selection; high volatility may require shorter time frames, low volatility may benefit from longer time frames |
Time frame importance can’t be overstated in day trading. Your chosen time frame affects:
- Entry and exit points
- Risk management
- Profit targets
Understanding time frames is intrinsically linked to trading psychology. Shorter time frames can induce stress and impulsive decisions, while longer time frames may lead to missed opportunities and not enough.
Striking the right balance is essential for maintaining emotional stability and executing your trading plan effectively.
One-Minute Charts for Scalping
One-minute charts are the bread and butter for scalpers in day trading. These fast-paced charts provide a granular view of price action, allowing you to capitalize on minor fluctuations in the market.
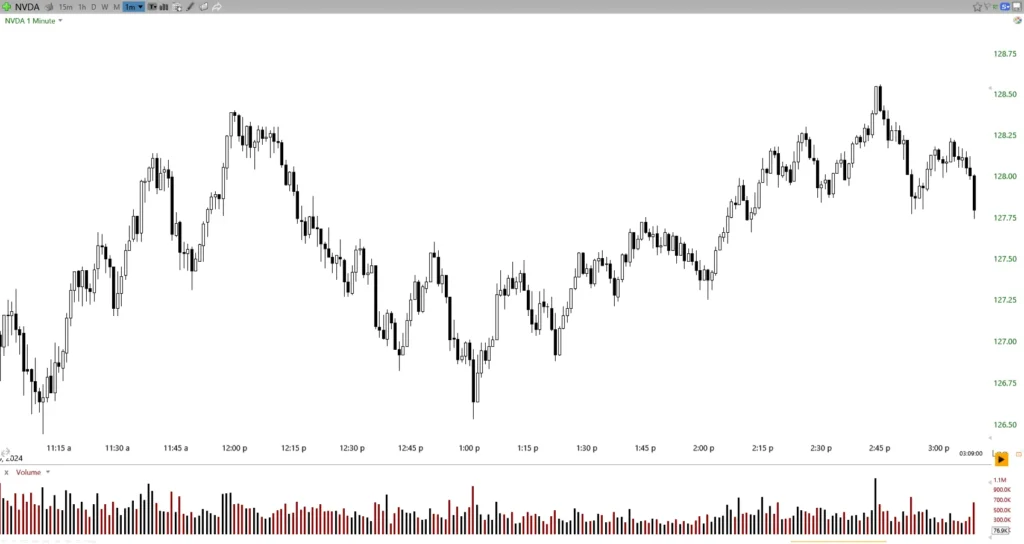
When implementing scalping strategies, you’ll need to be quick to get in and out of a trade, as positions are typically held for mere seconds to a few minutes.
Risk Management in One-Minute Scalping
- Set tight stop-losses: Given the rapid nature of scalping, you must establish strict exit points to limit potential losses.
- Use proper position sizing: Never risk more than 1-2% of your account on a single trade.
- Implement a high win-rate strategy: Aim for a success rate of 60% or higher to offset commission costs.
Key Considerations:
- Liquidity: Focus on highly liquid assets to guarantee smooth entries and exits.
- Spreads: Choose instruments with narrow bid-ask spreads to minimize transaction costs.
- Volume: Pay attention to volume indicators to confirm price movements.
Five-Minute Charts for Short-Term Trends
Five-minute charts offer a balanced approach for day traders seeking to capture short-term trends. These charts provide a comprehensive view of price action, allowing you to identify potential entry and exit points with greater accuracy.

When implementing five-minute strategies, you’ll find that this time frame strikes a prime balance between noise reduction and timely information.
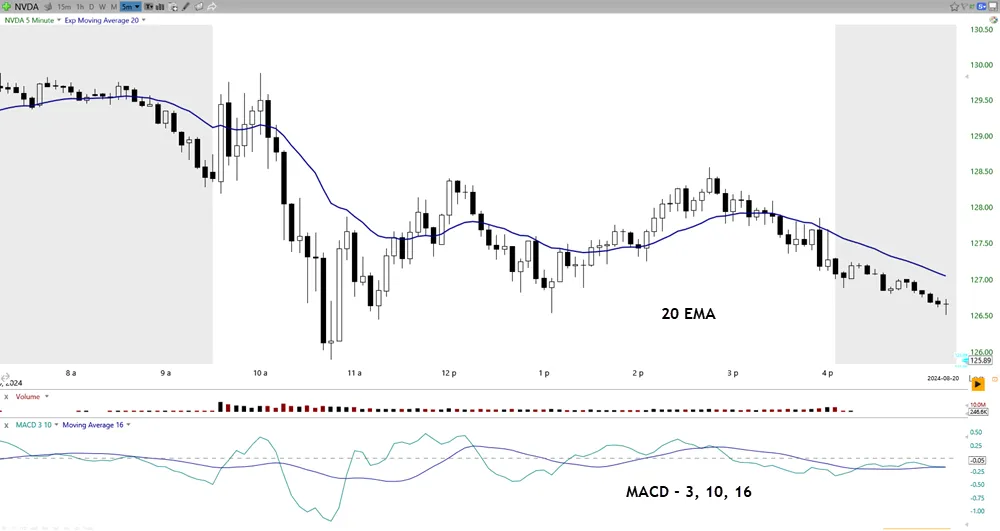
To effectively utilize five-minute charts, consider incorporating these key five-minute indicators:
- Moving Averages (e.g., 20-period EMA)
- Relative Strength Index (RSI)
- Bollinger Bands
- MACD (Moving Average Convergence Divergence)
These indicators, when used in combination, can help you identify trend direction, momentum, and potential reversal points.
It’s important to mention that five-minute charts are particularly useful for:
a) Identifying intraday support and resistance levels
b) Spotting short-term trend reversals
c) Timing entries and exits with greater precision
Fifteen-Minute Charts for Intraday Patterns
Fifteen-minute charts offer you a broader perspective on intraday patterns, allowing for the identification of short-term trends that may not be apparent in smaller time frames.
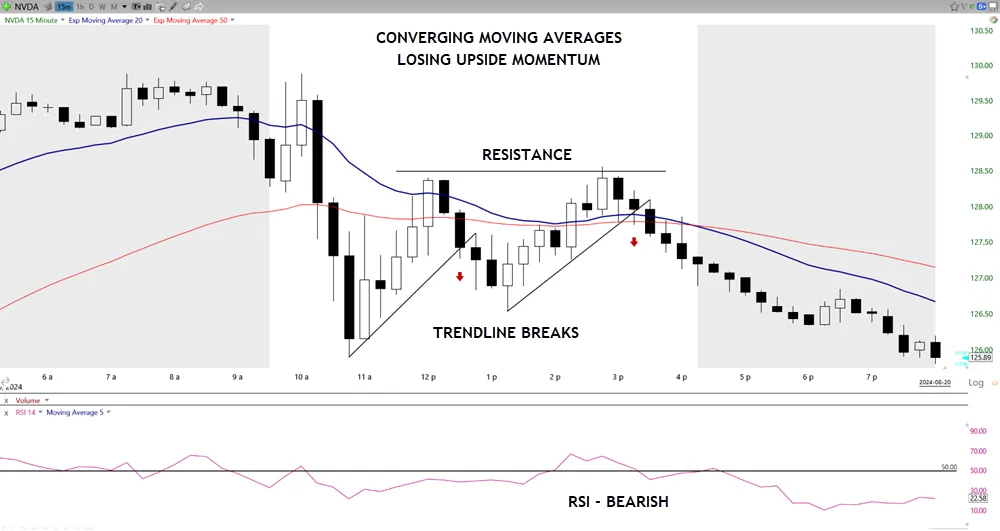
You’ll find these charts particularly useful for pinpointing key support and resistance levels, which often serve as pivotal points for price action throughout the trading day.
Zooming in on intraday patterns, fifteen-minute charts offer a balanced view for identifying short-term trends. They’re providing sufficient detail to capture significant price movements while filtering out minor fluctuations that can obscure the bigger picture.
To effectively pinpoint short-term trends, you’ll need to use various trend identification techniques and short-term indicators.
Key Trend Identification Techniques:
- Moving Averages: Use 20-period and 50-period EMAs to gauge trend direction.
- Trendlines: Draw lines connecting higher lows (uptrend) or lower highs (downtrend).
- Price Action: Analyze candlestick patterns and support/resistance levels.
Short-Term Indicators for Trend Confirmation:
- RSI (Relative Strength Index): Helps identify overbought/oversold conditions.
- MACD (Moving Average Convergence Divergence): Signals trend changes and momentum.
- Stochastic Oscillator: Indicates potential reversal points.
When analyzing fifteen-minute charts, focus on the overall price trajectory and the relationship between current price action and key technical levels.
Support and Resistance Levels
Support and resistance levels play a vital role in identifying potential entry and exit points on fifteen-minute charts. These key levels, often representing support zones and resistance levels, provide valuable insights into market psychology and price action.
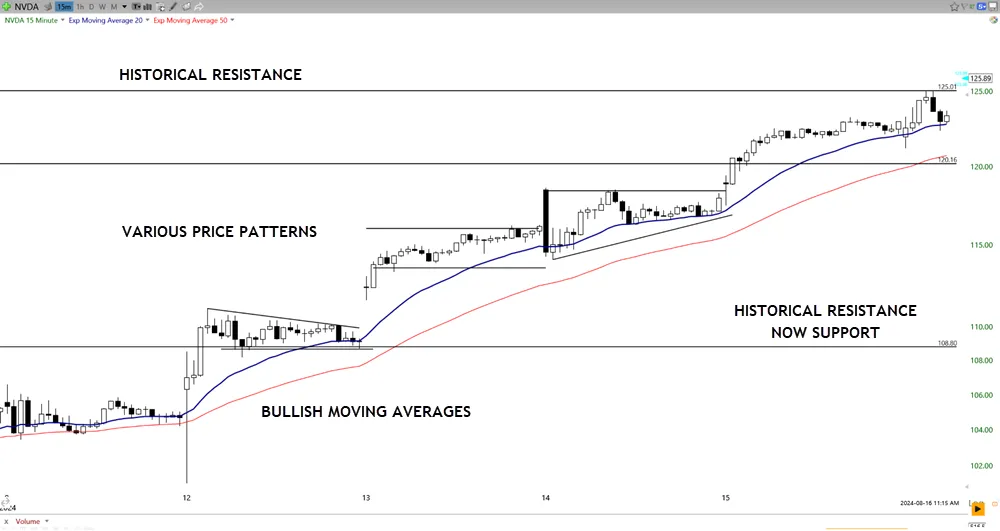
When analyzing fifteen-minute charts, you’ll want to focus on identifying these levels to develop effective breakout strategies and recognize potential reversal patterns.
To identify support and resistance:
- Draw trend lines connecting significant highs and lows
- Observe areas of price consolidation
- Utilize Fibonacci retracement tools
- Incorporate pivot points and historical levels
As you become proficient in recognizing these levels, you’ll notice how price often respects them, bouncing off support or struggling to break through resistance.
This knowledge can inform your trading decisions, helping you anticipate potential reversals or breakouts.
Volume-Price Relationship Analysis
Three key elements converge when analyzing volume-price relationships on fifteen-minute charts: price movement, trading volume, and time. This timeframe provides an ideal balance for intraday traders, offering enough granularity to identify significant patterns without overwhelming you with noise.
Volume-Price Relationship Analysis:
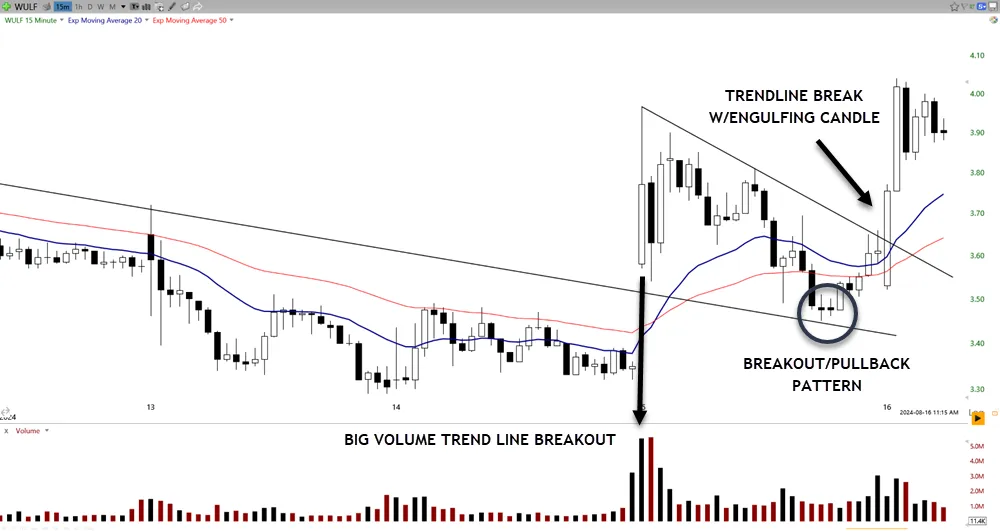
- Volume Confirmation:
- Look for volume spikes coinciding with price breakouts or reversals
- Higher volume validates the strength of a price move
- Low volume during price changes may indicate a false breakout
- Price Action Patterns:
- Identify candlestick formations, such as doji or engulfing patterns
- Observe trend lines and channel formations
- Monitor support and resistance levels established within the timeframe
- Divergence Detection:
- Compare volume trends with price movement
- Decreasing volume in an uptrend may signal weakening momentum
- Rising volume in a downtrend could indicate a potential reversal
Hourly Charts for Broader Context
Hourly charts provide you with a broader perspective on market dynamics, essential for effective day trading strategies.
You’ll find these charts invaluable for identifying key support and resistance levels, which often act as critical pivot points for price action.
Identifying Key Support Levels
When looking at hourly charts for day trading, you’ll gain a broader perspective on key support levels. These levels often correspond to significant price points where buying pressure has historically outweighed selling pressure.
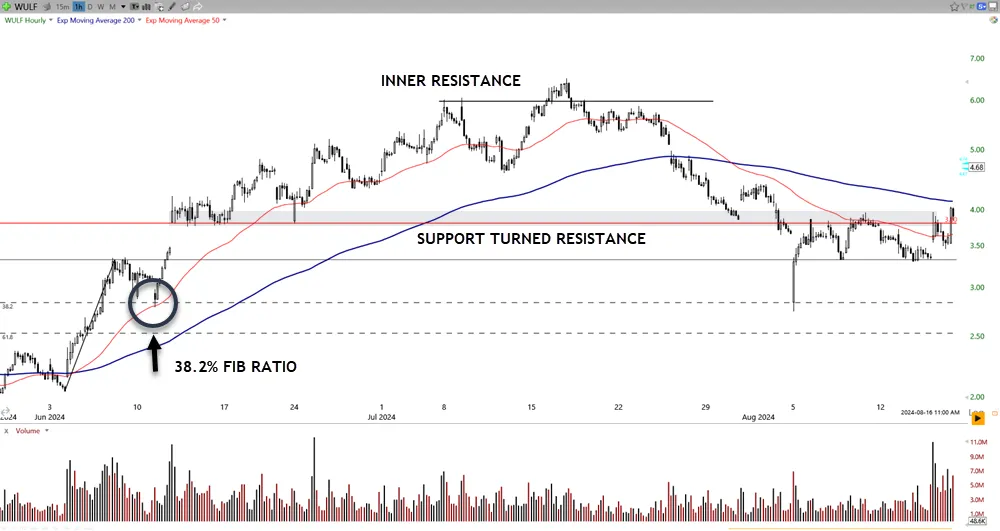
Key support levels typically show up as:
- Previous swing lows or highs
- Moving averages, particularly the 50-day and 200-day EMAs
- Fibonacci retracement levels, especially the 61.8% and 38.2% marks
As you analyze hourly charts, pay close attention to psychological barriers, such as round numbers or previous all-time highs. These levels often act as strong support or resistance, influencing trader behavior which will influence the price on the chart.
To effectively identify key support levels, consider using multiple technical indicators and chart patterns. Look for confluence between various tools, as this strengthens the significance of a particular level.
Spotting Major Trend Reversals
Trend reversals can be game-changers for day traders especially those with a trading plan to trade them. When analyzing hourly charts for a broader context, you’ll want to focus on key trend reversal indicators and market psychology factors. These elements often signal potential shifts in market direction, providing lucrative opportunities for the astute trader.
To spot major trend reversals:
- Monitor price action: Look for double tops/bottoms, head and shoulders patterns, or breakouts from established trendlines.
- Analyze volume: Increasing volume during a reversal often confirms the shift’s validity.
- Observe momentum indicators: RSI, MACD, and Stochastic Oscillator can provide early reversal signals.
- Track sentiment shifts: News events, economic data releases, or changes in market sentiment can trigger reversals.
Gauging Overall Market Sentiment
Building on the ability to spot trend reversals, understanding overall market sentiment is key for day traders. Hourly charts provide a broader context, allowing you to gauge the overall mood of the market. This wider perspective helps you align your trades with the prevailing market psychology and trader sentiment.
When analyzing hourly charts for market sentiment, consider:
- News impact and social media influence on trader emotions
- Economic indicators and their effect on market volatility
- Sentiment indicators and their reflection of collective risk appetite
Remember, market sentiment can shift rapidly, so it’s essential to stay informed and adaptable.
Utilize specialized tools and platforms that aggregate sentiment data, providing you with real-time insights into trader emotions and market psychology. These resources can help you identify potential trend continuations or reversals before they fully materialize.
As you develop your skills in gauging overall market sentiment, you’ll find yourself better equipped to make informed decisions and capitalize on emerging opportunities in the fast-paced world of day trading.
Multiple Time Frame Analysis Techniques
Multiple time frame analysis is a powerful tool in a day trader’s arsenal. This approach involves examining charts across different time intervals to gain a comprehensive view of market dynamics.
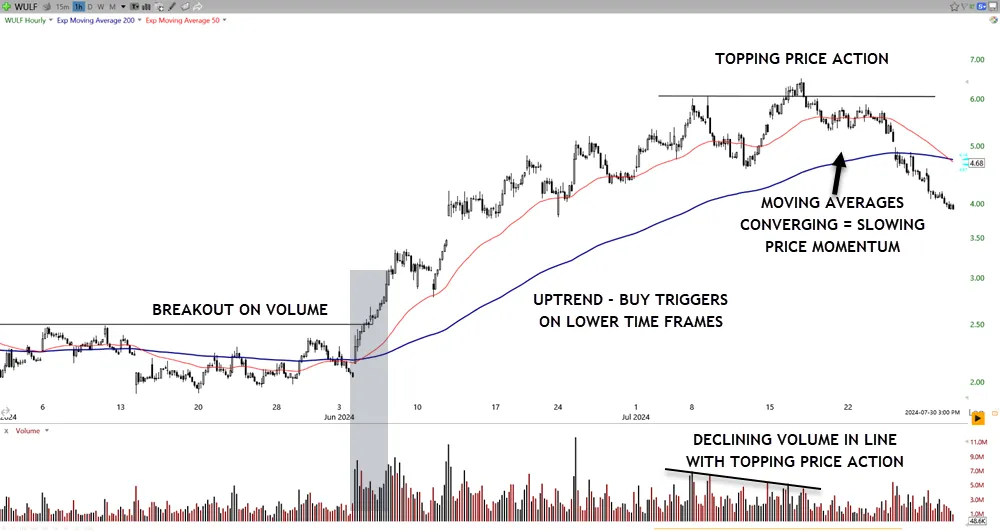
You’ll improve your trend confirmation techniques and refine your risk management approaches by implementing multiple time frame strategies.
To effectively utilize this method:
- Start with a longer time frame to identify the primary trend.
- Move to intermediate time frames for potential entry points.
- Use shorter time frames to pinpoint precise entry and exit signals.
Volatility assessment methods become more accurate when applied across multiple time frames, allowing you to gauge market conditions more effectively.
Correlation analysis tools can help you identify relationships between different assets and time frames, providing additional context for your trades.
Choosing the Right Time Frame
Selecting the right time frame is a fundamental aspect of successful day trading. Your choice of time frame can significantly impact your trading psychology and overall performance.
When determining the ideal time frame for your strategy, consider the following factors:
- Your trading style and personality
- The volatility of the assets you’re trading
- Your risk tolerance and profit objectives
Time frame selection is essential for maintaining consistency in your trading approach. Shorter time frames, such as 1-minute or 5-minute charts, provide more frequent trading opportunities but can also lead to increased noise and false signals.
Longer time frames, like 15-minute or 30-minute charts, offer a clearer view of market trends but may result in fewer trading opportunities.
To enhance your timeframe selection, analyze your trading goals and preferred holding periods. If you’re a scalper looking for quick profits, you’ll find shorter timeframes more suitable.
If you prefer swing trading or position trading, longer time frames might align better with your strategy.
Frequently Asked Questions
How Do Economic News Releases Affect Different Time Frame Analyses?
Economic news releases impact your analyses across time frames. They trigger market volatility, shift trader sentiment, and affect economic indicators. You’ll notice heightened activity during news anticipation periods, influencing short-term and long-term trading decisions alike.
Can Seasonal Patterns Influence the Effectiveness of Specific Time Frames?
Yes, seasonal patterns can influence time frame effectiveness. You’ll notice seasonal trends impacting shorter time frames more intensely. Your trading psychology may need adjustment as you adapt to these cyclical changes in market behavior throughout the year.
What Role Does Trading Volume Play in Selecting Optimal Time Frames?
When selecting ideal time frames, you’ll want to take into account trading volume. Pay attention to volume trends and volume spikes. They can indicate increased market activity and potential price movements, helping you choose the most effective time frames for your trades.
How Do Pre-Market and After-Hours Trading Impact Various Time Frame Strategies?
You’ll find that pre-market trends can set the tone for your day trading strategy. After-hours volatility might influence your longer time frames. Consider how these extended trading periods affect your chosen time frames and adjust accordingly.
Are There Specific Time Frames Better Suited for Trading Certain Asset Classes?
You’ll find that certain asset classes suit different time frames. For stocks, short-term strategies often work well with 1-5 minute charts. Forex and commodities may benefit from longer time frames, aligning with long-term perspectives.
Conclusion
There’s no one-size-fits-all approach; your ideal time frame depends on your trading style, risk tolerance, and market conditions. Experiment with multiple time frames to develop a comprehensive market perspective. By mastering the art of time frame selection and integration, you’ll improve your trading precision, enhance risk management, and ultimately increase your potential for consistent profitability in the dynamic world of day trading.
