- July 29, 2021
- Posted by: Shane Daly
- Categories: Basic Trading Strategies, Trading Article

I made a post in 2020 about trading the daily time frame and included a simple trading strategy to go along with it.
The video I posted on Youtube hit almost 20K views (video is below) and there were many comments excited about using the strategy.
Let’s circle around and take a look at some trades that were available since that video was produced.
I am going to take a look at some of my favorite “go to” instruments including some found in our Options trading guide: TOP 12 NASDAQ OPTIONS SUPERSTARS
Daily Time Frame Strategy Walkthrough
In case you never read or watched the video about the strategy:
The trading rules are as follows for buys:
- Wait for price to break above the 20 period moving average
- 2 candle lows must plot completely above the moving average to point out a trading signal
- After the second lows plots, place a buy stop order at 20% ATR above the high of the highest high of the two candles
- Set your stop 20% ATR from below the moving average
- Trail your stop loss using the moving average
Trading short positions is the opposite of taking long positions.
In order to not boor you with a ton of setups, I will look at the most recent market action. This makes a good review of the strategy.
Apple
This is a great example of the perfect setup. The entry price was fairly close to the moving average which is used as part of the stop calculation keeping the risk in dollars, small.
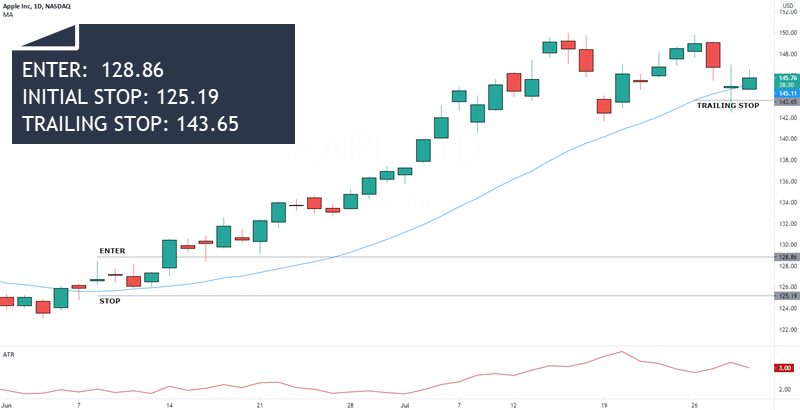
Using a trailing stop method to lock in profits, this move recently ended with $14.79 profit per share on an initial risk of $3.67.
This is a good example of the entry price being further from the initial stop loss location.
Once you see a bigger risk, you will have a smaller position size in the instrument.
The end result on this long trade is $7.98 per share.
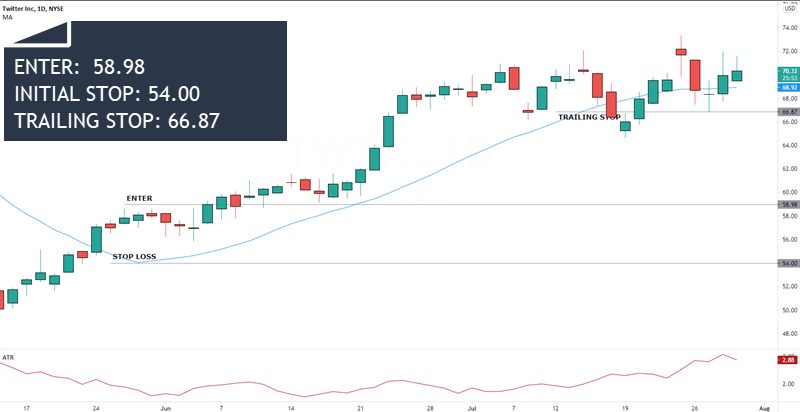
There are some tweaks to the strategy you can consider.
You can see once the entry candle was set, price had a few days of consolidation. Traders may decide that the bottom of the consolidation (for a buy) is a good location for the stop once price breaks out of the high of the entry candle which triggers the trade.
This will allow you to have a smaller risk per trade resulting in a better position size. The theory is that if price breaks out and then drop back through the range, buying interest is not as strong as we’d like.
Nvidia
This is an example of using the adjusted stop loss due to the range that occurred.
The original stop would have been $13 from entry while the adjusted stop using market structure is $4.89 which is a much more acceptable number.
You would begin to trail your stop once the moving average -20% of ATR is higher than your original stop.
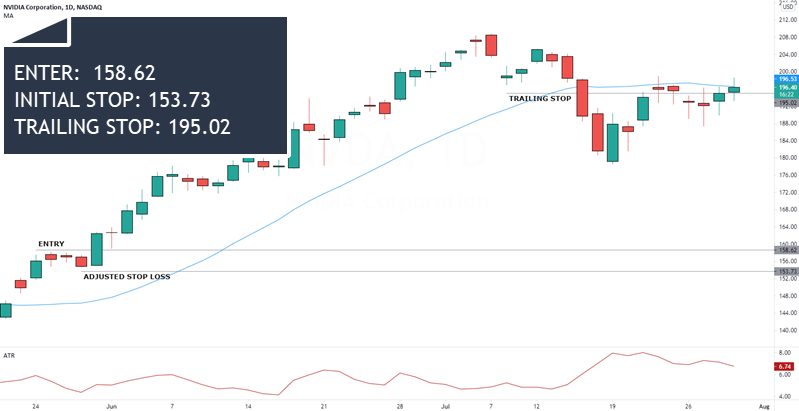
A good trade that never challenged your trailing stop on it’s way to $36 per share profit over almost 2 months.
Lyft
Another example of an adjusted stop. Notice the moving average dipping lower. That will automatically make your stop a little larger than ideal.
We didn’t get a range to put our stop under. This example is using the setup candlestick and using the low price minus the ATR calculation of 20%.
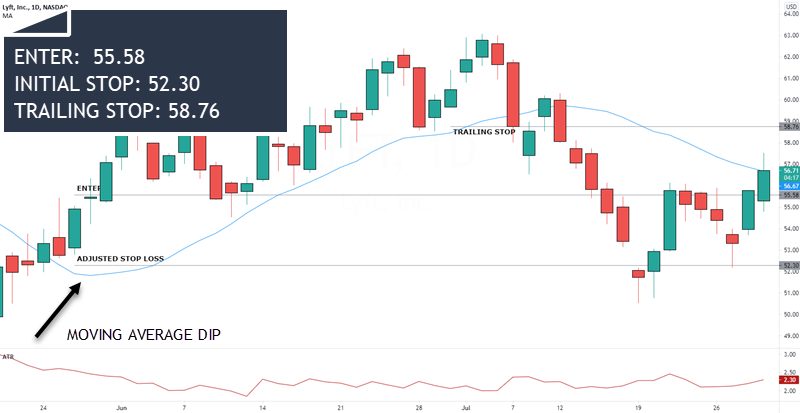
Not a stellar move as the reward was a little less than your risk. Not ideal but we can’t control how far the market is going to go.
Other Stocks
There are other stocks with much higher per share prices such as Amazon. In those cases, you’d want to take advantage of the Options market. To learn about those opportunities, drop Mike@netpicks.com an email and he can walk you through our Options trading program
Bitcoin
There are many traders of Bitcoin looking to hold their positions. They are just looking for good buy points.
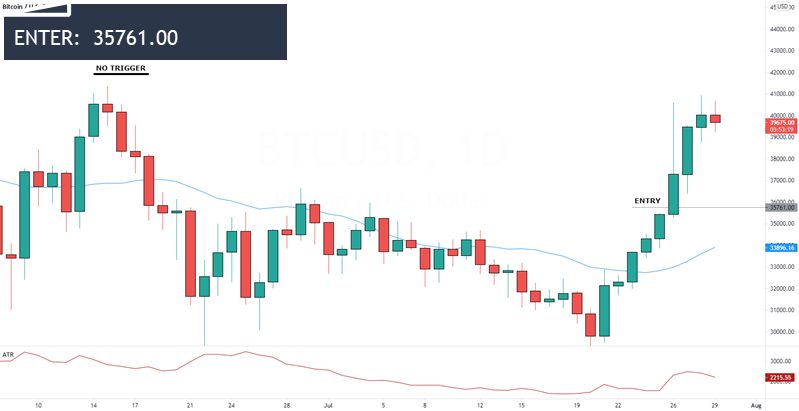
On the left, you can see how using the ATR x 20% added to the high gives a buffer from price.
That entry did not trigger.
On the right, you get a better entry without a stop loss for those looking to take Bitcoin as far as it will run.
For those traders, I would consider an exit if a short setup and trigger occurs if you have trouble seeing the gains disappear.
Forex
As I have mentioned many times over the years, price action is what eventually rules.
This is the daily FX chart of the GBPJPY.
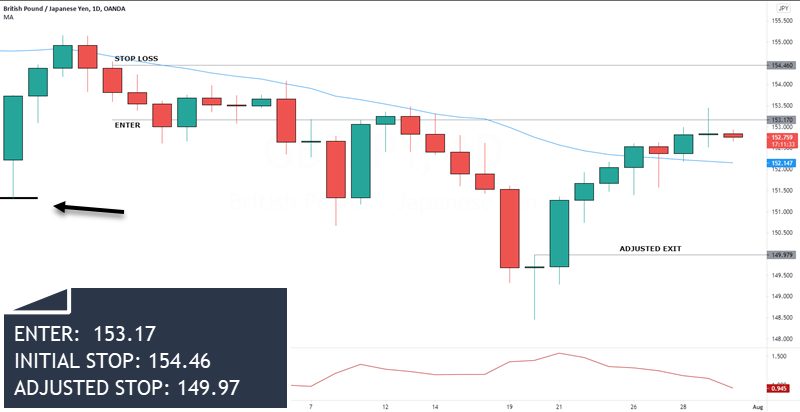
The candle with the arrow was an entry price that wasn’t hit on the first short.
The second trade is obvious and this is the stop set over the high of the setup candlestick. This trades very well into a target that gives up 320 pips.
Why is the exit adjusted to something other than the trailing stop?
This is an obvious reversal candle that sets up not only at a round number, but also previous support.
When face with an obvious reversal setup, you’d be smart to take your profits. For those keeping score, the current long setup has a trigger of 153.67.
S&P E-Mini
Let’s wrap this up with a day trading time (15 minute) from on the ES.
While this was set up for the daily time frame, I know some traders have been using it on the lower time frames.
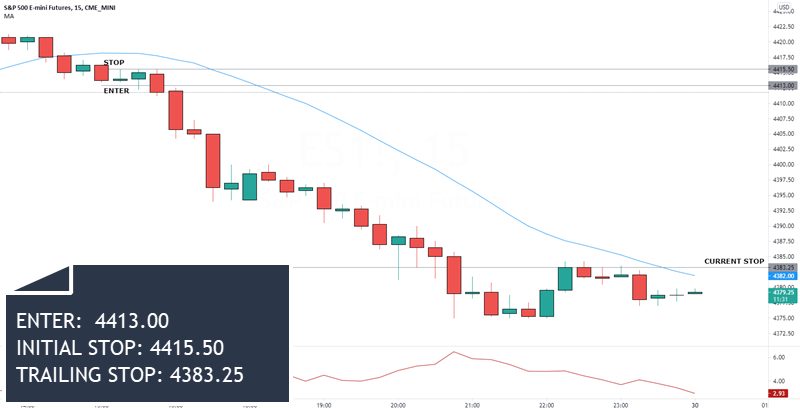
It is traded no differently than the others ones.
You can see at the time of this screen grab, you would be well into profit and looking for an exit when price goes long.
In the case of any gap in price that changes trade direction, I would exit the trade at the first opportunity.
Conclusion
There is a reason why the original post of this strategy has done very well. It is simple to use and requires only two technical indicators and a basic knowledge of price.
Feel free to play with different stop loss placements as well as trailing methods. This already uses my favorite indicator, the average true range, so I personally don’t have a reason to change it.
I hope you have found this useful. If so, please leave a comment letting me know you do.
