- November 14, 2017
- Posted by: CoachShane
- Categories: Advanced Trading Strategies, Trading Article

When exploring various trading strategies, one pattern that stands out is the inside bar pattern. This pattern indicates market indecision and can serve as a valuable tool for understanding the current price condition on the chart. It signals a pause in the current trend, suggesting that a new group of buyers or sellers is gaining momentum.
 By mastering the inside bar pattern, you gain insight into moments when the market is holding its breath before a significant move. This method can be integrated into your trading strategy, providing a glimpse into potential volatility and possible trading opportunities.
What Is An Inside Bar (Candlestick)?
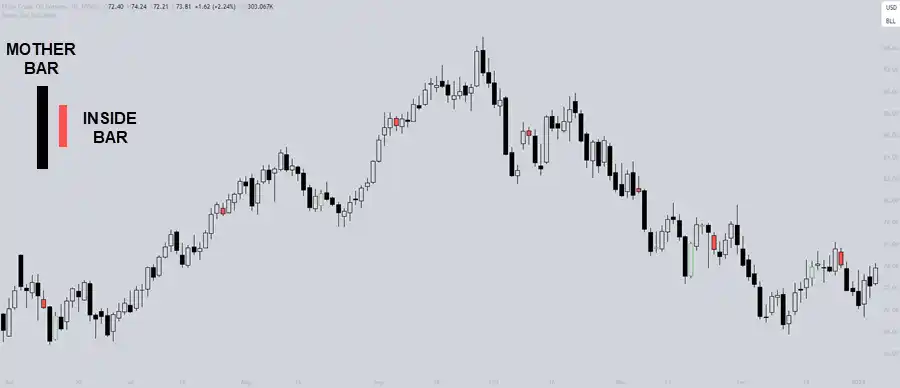
As the name implies, an inside candlestick forms inside the range of the previous candlestick. Keep in mind that there can be more than one candlestick (bar) that forms and is also fully engulfed by the candlestick to the left. At a minimum, it is a two-bar pattern.

What does the inside bar indicate? In our graphic, we have a strong bullish candlestick.
Let’s step back for one second and be precise: the candlestick looks strong because it’s one of only two candlesticks shown. We can only say with confidence “strongly bullish” if the green candlestick is larger than most of the price action that would have formed to the left of it.
Let’s assume our green “mother bar” is the largest one in recent price action on the chart. The market has moved with momentum and the next candlestick on the chart can’t take out the previous bar high or low. We can say that volatility has dried up at this point or at least is not as strong as the previous move.
This happens as the move is digested. Remember we have traders using all different time frames so we could have traders:
- Taking profits on their buys from a lower time frame
- Momentum traders bailing as there is no follow-thru
- Contrarian traders (who may be trend traders from another time frame) taking short positions
There are more reasons but we can’t cover all scenarios..just the higher level ones. Understand that when you see this type of chart pattern, whether Forex trading or trading stocks, you are looking at inside bar trading type of setups that depend on momentum showing up to carry price through the high/low of the previous candlestick.
Inside Bar Pattern = Triangles
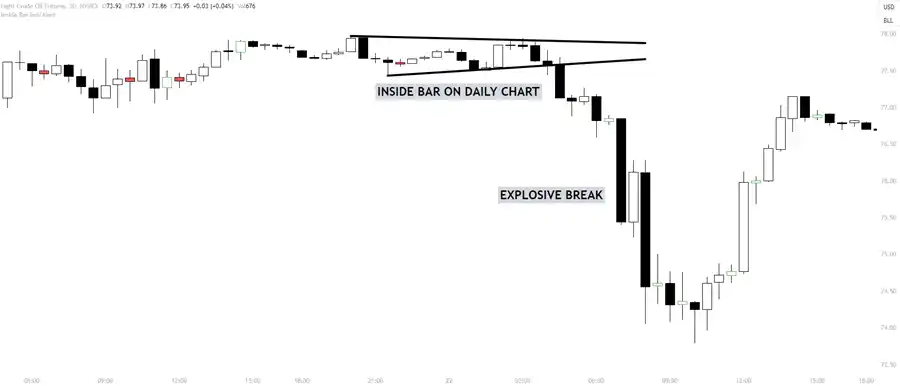
 When looking at higher time frames inside bars, the reason the moves from these can be explosive is due to the lower time frame patterns. Triangles on a lower time frame are inside bars on higher time frames. As we know with triangles, when the price explodes from them, especially if the price reaches the apex, the breakout can be strong.
Does Time Frame Matter With Inside Bars?
On a lower time frame chart, we are going to have many inside bars showing up and, as mentioned, the triangle price pattern. If you are trading a 15-minute chart and are trading Forex, in one 24 session you will see 96 bars. Given that there are slower sessions in Forex, you have the potential to see too many inside bars that you may decide to trade.
Trading an inside bar strategy without context or location is a mistake. It is not a trading strategy by itself.
There is nothing inherently important about an inside bar showing up on a chart in most locations. That’s not to say that lower time frame charts are useless for trading. You never know which time frame will start to exert control.

For my money, I believe there is a lot of noise in the markets and I (and many others) prefer looking for any type of candlestick pattern not on day trading time frames but on the higher time frame charts.
Higher time frame charts such as the daily chart remove a lot of the noise of the market. The setups are much cleaner.
There are several inside candlesticks on this chart and the majority of them do not lead to any type of trade that is worthwhile. We are seeing just normal price evolution. The presence of these inside candles could be considered meaningless in the grand scheme of things.
Let’s also consider that there may be places in these lower time frames where an “inside bar trading strategy” will work wonderfully. Look at the top of the chart prior to the move downwards. That is a rally on the daily chart that ends with the collapse. (Keep this in mind – it will come in handy later)
Location’s Not Just For Real Estate
If we can agree that there is no edge in simply selling or buying areas where inside bars show up, what type of strategy can we use?
We can use any type of trading strategy – it’s not an inside bar trading strategy though. We are not trading the inside bar, we are trading location, structure, and market mechanics, and using the inside bar as a trade entry strategy.
That is a vital distinction.
Look for inside bars to show up in areas where we can expect some type of price reaction. Look for inside bars around support/resistance levels, at either side of a trading range, even at the end of pullbacks against the trend.
Remember that inside bars show us a lack of volatility as the move is digested. We are looking for relief of that pressure that builds up in consolidations to get us into a trade at a favorable location on the chart.

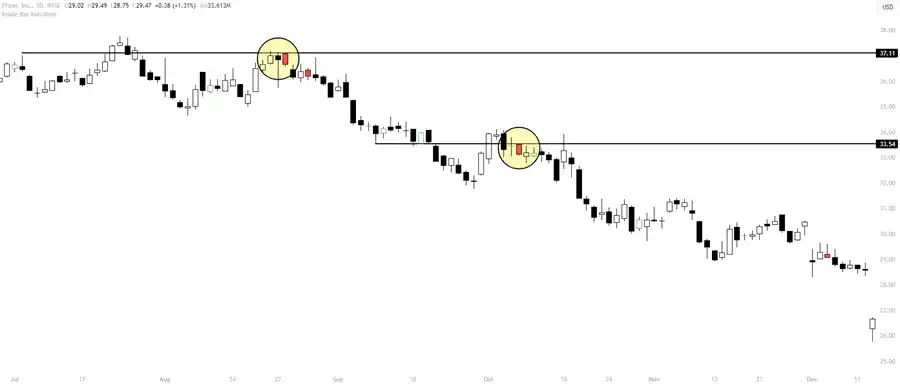
This is a daily stock chart of PFE and 2 inside bars are showing up at a good location in a downtrend.
The first one is an aggressive entry on a head and shoulders type of pattern. Instead of waiting for a break of support, we trade the break of the low of the inside bar.
The second inside bar shows up during a pullback that fails into a trading range. Both are good setups in the context of the downtrend and in the location in which they appear.
Entry and Exit Strategies
When trading inside bar patterns, you need to find the best entry and exit points to maximize your trades’ potential. To trade inside bars, you need to incorporate sound strategies for entering and exiting trades.
Here’s a step-by-step approach:
- Determine the optimal entry point by considering the position of the inside bar relative to the preceding bar. If the inside bar is near the top or bottom, it could indicate a strong continuation or reversal.
- Use inside bars as signals to enter trades during pullbacks in trending markets or at key levels for counter-trend trades that align with the overall market direction.
- Initiate your trade by placing a buy-stop or sell-stop order just above or below the high or low of the mother bar. This method ensures that you enter the market as momentum starts to build but there is no guarantee of follow-through.
- Set your stop loss order at the opposite end of the mother bar to protect your trade, or near the mid-point if you prefer a tighter risk management strategy.
As mentioned earlier, trading inside bars on the daily chart is recommended as it reduces the likelihood of false breakouts and increases the reliability of your signals. The pattern typically offers good risk-reward ratios with obvious stop and entry prices.
Risk Management Techniques
Risk management is a vital aspect of the inside bar pattern and trading in general. It helps protect you from unexpected market movements and keeps potential losses under control. One effective technique that was mentioned is to set up stop-loss orders on every trade. These orders act as your first line of defense, preventing small losses from turning into devastating hits to your account.
Position Sizing
Position sizing is a big part of risk management strategies to mitigate financial risk and enhance potential gains. It involves determining the appropriate amount of capital to allocate to each trade based on your risk tolerance and overall trading strategy. By calculating position size, traders ensure that even if a trade doesn’t go as planned, the impact on their total portfolio is limited and manageable.
Let’s say you have a $50,000 trading account and you’re willing to risk 1% of your capital on a single trade. This means you’re willing to lose $500 on this trade (1% of $50,000). You’re interested in a stock that’s currently trading at $100 per share and, based on your analysis, you decide to place a stop-loss order at $95. This stop-loss order is $5 below the purchase price.
To calculate the position size (the number of shares to buy), you would determine how many shares you can purchase without exceeding your $500 risk threshold. Since you’re risking $5 per share (from $100 down to the $95 stop-loss), you can buy 100 shares of the stock. If the price drops to $95 and triggers your stop-loss, you will sell your shares for a $500 total loss, which is within your risk tolerance.
Here’s the calculation:
- Risk per trade = 1% of $50,000 = $500.
- Risk per share = Purchase price – Stop loss = $100 – $95 = $5.
- Position size = Risk per trade / Risk per share = $500 / $5 = 100 shares.
So, you would buy 100 shares of the stock at $100 each. This position sizing strategy ensures that you’re only risking 1% of your account on the trade which lines up with your predetermined risk management strategy.
Inside Bar Pullback Trading Strategy
That title is a little “tongue in cheek” but we can even use an inside bar pattern to help us get on board the trend after the price has a pullback.
This chart is the four-hour chart of the daily chart that is shown in the inset. The daily chart pulls back to a location that was once resistant and has the potential to act as support. Once the price hits the area, you can drill down into a lower time frame to find an inside candlestick to get you into the trade.

You can see with the blue lines the high and low of the mother bar defined which can also be considered a trading range. There are multiple candles inside of the mother bar but we do get a poke below the low of the mother bar.
Is that a concern? No. It is a natural evolution of price and does not discount the impact a break of the mother bar can have. That type of price action adds to the probability of an upside break and the probability of a break that will last.
We have the consolidation, and the price compression, and from that, we know that momentum of some sort will arrive. We have this all happening at a significant level from a higher time frame chart. We are using the lower time frame pattern – the inside bar – to get us in a trade from a higher time frame pattern, the pullback.
Price holding above on the break above the mother bar high is still a sign of the bulls in power, especially after seeing the sharp push in and close back outside the breakout level.
Inside Bars Happen In All Markets In Any Time Frame
From the Forex market to stocks, inside bars can show up on any chart and time frame. Most of them are meaningless and simply show a pause in the price advancement.
For my money, I much prefer seeing this and all chart patterns on the daily chart and above. I find when the inside bar pattern breaks while in the context of a pattern such as a pullback, the daily chart and higher give more bang for the buck.
In the context of some type of trading structure or pattern such as a pullback, the break of the mother bar high signifies an increase in momentum from a period of lower momentum shown by the inside bar pattern.
You must have a trading plan when you are choosing to use this chart pattern as part of an overall trading strategy. The inside bar strategy does not truly exist on its own but can be a useful objective trade trigger when appearing in price patterns that are centered around the tendencies of the markets.
Frequently Asked Questions
What Is the Inside Bar Pattern in Trading?
The inside bar pattern in trading occurs when a small candle is enclosed within the range of the previous candle on a price chart. This indicates market indecision before a potentially significant price movement.
Is Inside Bar Trading Profitable?
Inside Bar Trading can be profitable if you have a solid strategy, use it alongside other indicators, and prioritize effective risk management. It’s important to note that these elements are important for success, and without them, the probability of a winning trade will diminish.
How Accurate Is Inside Bar Trading Strategy?
If you’re curious about the accuracy of a specific trading strategy, it’s important to consider a few factors. This strategy tends to be reliable when you take into account higher time frames and align it with the overall market trend. However, no method can guarantee success on its own. Proper risk management and confirmation are essential for achieving favorable results.
What Is the Inner Bar Strategy?
The inner bar strategy involves analyzing candlestick charts to identify smaller price bars that form within the range of a larger one. These smaller bars suggest potential market moves after consolidation. A complete inner bar strategy will include position sizing, entry price, stop loss zones, and profit targets.
Free Trading Guide
Improve your trading strategy with our comprehensive guide, “50 EMA Trading Strategy”. This is perfect for traders looking to take advantage of the power of trends and momentum with a simple, yet effective approach. Just like mastering the inside bar pattern provides you with insights into market volatility and potential trading opportunities, our 50 EMA guide will equip you with a robust strategy to identify profitable trades. You can grab it by clicking here.
