- December 5, 2024
- Posted by: CoachShane
- Categories: Advanced Trading Strategies, Trading Article, Trading Indicators

If you’ve ever wondered why market prices seem to reverse at certain predictable levels, you’re about to discover one of trading’s most intriguing tools. Fibonacci retracement, based on a mathematical sequence found throughout nature, helps traders identify potential reversal points with exceptional accuracy.
While it may sound complex, you’ll find that these golden ratios offer a systematic way to spot trading opportunities and manage risk. The real power lies in understanding how these mathematical principles align with market psychology – and that’s exactly where this journey begins.
Ready to master breakout trading without risking a dime? Download our FREE Breakout Trading Plan and learn how to: Spot high-probability breakout setups | Set effective stop losses and profit targets | Execute a winning trading strategy.
TRY IT WITH FIBONACCI LEVELS! Don’t miss your chance. DOWNLOAD TODAY.
TLDR
- Fibonacci retracement identifies potential reversal points in market trends using key percentage levels: 23.6%, 38.2%, 50%, 61.8%, and 100%.
- Traders draw Fibonacci lines by connecting significant swing highs and lows on price charts to calculate potential support and resistance levels.
- The tool works best in trending markets rather than sideways markets, helping traders find entry points during price pullbacks.
- Successful trading requires combining Fibonacci levels with other technical indicators and proper risk management strategies.
- The 38.2% level indicates shallow retracements, while the 61.8% level suggests deeper pullbacks, helping traders anticipate price movements.
Understanding the Fibonacci Sequence
Mathematics’ most fascinating sequence forms the foundation of Fibonacci retracement trading.
You’ve seen the Fibonacci sequence in nature without realizing it – it’s found in everything from seashells to sunflower patterns. The sequence begins with 0 and 1, with each subsequent number being the sum of the previous two: 0, 1, 1, 2, 3, 5, 8, 13, 21, and so on.

The sequence’s origins date back to ancient Indian mathematics, but it was Italian mathematician Leonardo Fibonacci who popularized it in Western culture during the 13th century.
Fibonacci’s mathematical properties exploration reveals patterns, including the golden ratio of approximately 1.618, which appears when you divide any number in the sequence by the previous one.
Beyond nature, you’ll spot Fibonacci in art throughout history, from the proportions of the Great Pyramids to Renaissance paintings.
These historical Fibonacci applications demonstrate why traders find it so appealing – it’s a pattern that seems to capture something fundamental about how things grow and change.
This natural tendency toward certain proportions makes it a valuable tool for predicting potential market movements.
The 38.2% retracement level derives from subtracting the golden ratio from 1, making it an important reference point for traders.
Core Retracement Levels
In Fibonacci analysis, traders rely on specific percentage levels to identify potential reversal points in price movements. These core Fibonacci levels are 23.6%, 38.2%, 50%, 61.8%, and 100%, and they’ll help you spot potential areas where price action might change direction.
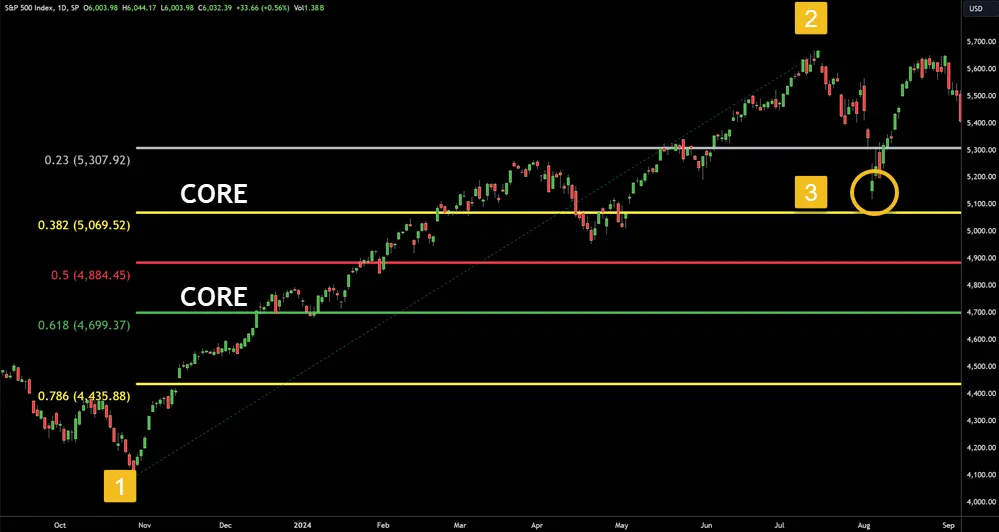
When you’re analyzing market trends, you’ll want to focus on these key retracement patterns. The 38.2% level often acts as a shallow pullback point, while the 61.8% level is considered a deeper retracement that still maintains the original trend.
The 50% level, though not technically a Fibonacci number, is widely used because it represents a midpoint that frequently provides strong reversal signals.
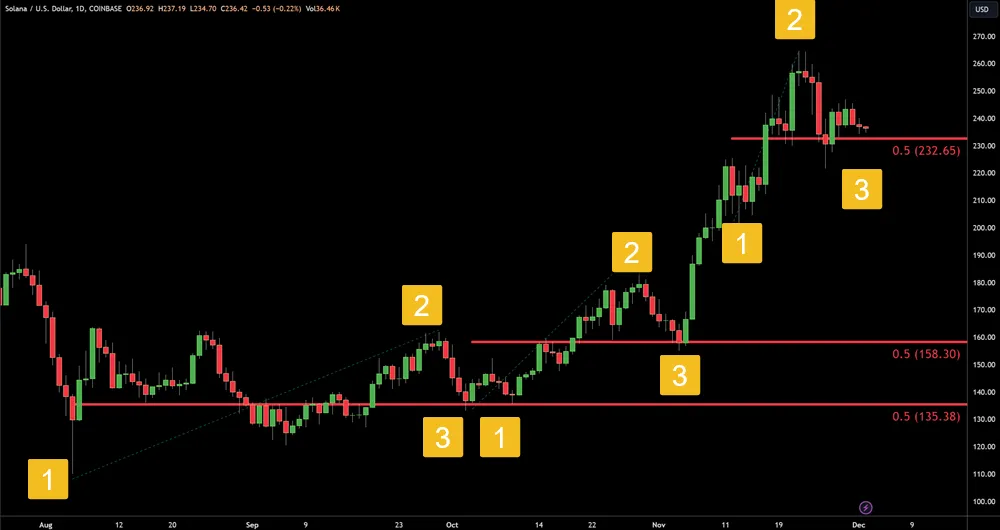
You’ll find that price action tends to respect these levels, especially in trending markets. To use them effectively, wait for additional confirmation when price reaches a Fibonacci level – like candlestick patterns or other technical indicators.
Drawing Fibonacci Lines
While understanding the core Fibonacci levels is fundamental, drawing these lines correctly on your charts requires specific techniques. You’ll need to identify significant price patterns and market trends before you can effectively plot your Fibonacci levels.
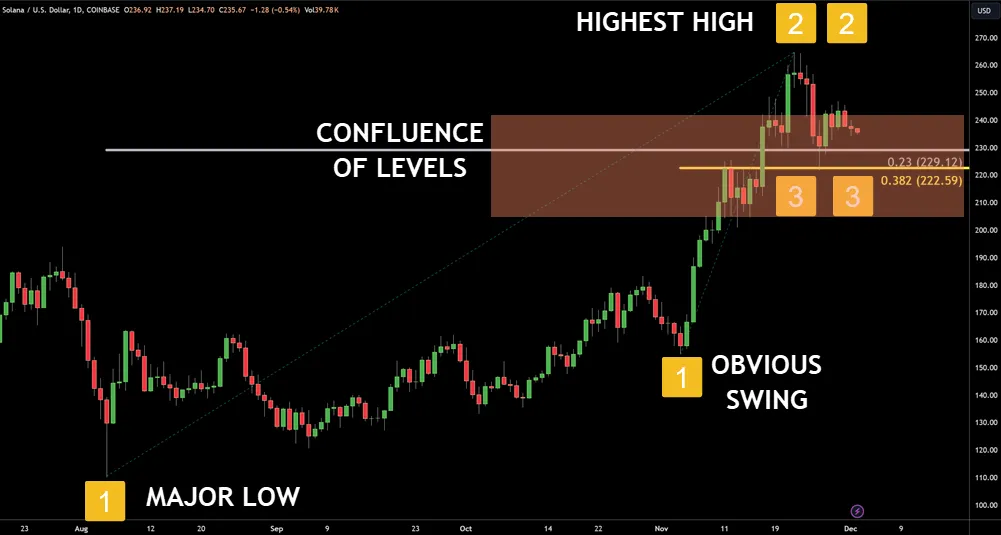
Start by locating a clear swing high and swing low on your chart – these points will serve as your anchors.
| Trading Direction | Starting Point | Ending Point | Drawing Method |
|---|---|---|---|
| Uptrend | Swing Low | Swing High | Bottom to Top |
| Downtrend | Swing High | Swing Low | Top to Bottom |
| Sideways | Recent Low | Recent High | Either Direction |
| Consolidation | Break Point | Current Price | Based on Break |
Remember that trader psychology often influences where you’ll place these lines. When drawing your retracement analysis, you’ll want to focus on the most recent and significant price movements. Most trading platforms will automatically calculate the Fibonacci levels once you’ve selected your two anchor points.
Don’t worry if you need to adjust your lines a few times – it’s normal to fine-tune your analysis as market conditions change. Keep in mind that the most reliable signals often come when multiple Fibonacci levels align with other technical indicators.
Market Psychology Behind Retracements
Trading psychology plays a central role in why Fibonacci retracements work so effectively in financial markets. When you understand the way traders think and react to price movements, you’ll see why these mathematical levels often become self-fulfilling prophecies.
Market sentiment tends to cluster around these key retracement levels, creating natural support and resistance zones.
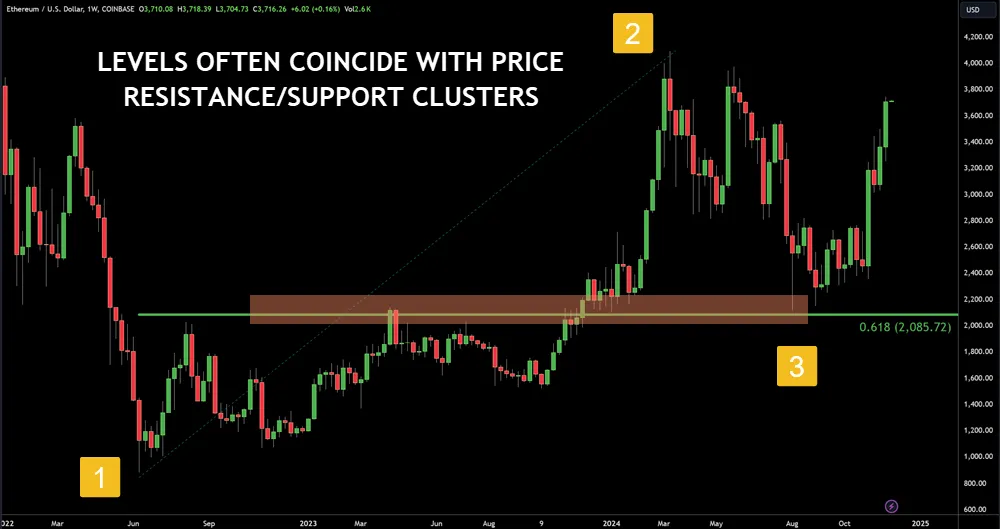
You’ll notice that trader behavior often follows predictable price patterns at these psychological levels. When many traders watch the same Fibonacci levels, they often make similar decisions about buying and selling.
This crowd psychology creates a powerful effect where traders’ collective actions reinforce the importance of these levels. For example, if enough traders believe the 61.8% retracement level will hold, they’ll place their orders there, effectively making it a significant support or resistance point.
Understanding these psychological aspects can help you better anticipate market moves. You’ll start to recognize how other traders react to these levels and how their collective behavior influences price action.
This knowledge gives you an edge in predicting potential reversal points and planning your trades accordingly.
Combining Fibonacci analysis with Alligator Indicator signals can provide stronger confirmation of trend direction and potential reversal areas.
Trading Entry and Exit Points
Determining the ideal entry and exit points with Fibonacci retracement levels can significantly improve your trading success rate. When you’re looking to enter a trade, you’ll want to watch for price action that confirms support at key Fibonacci levels, particularly during established market trends.
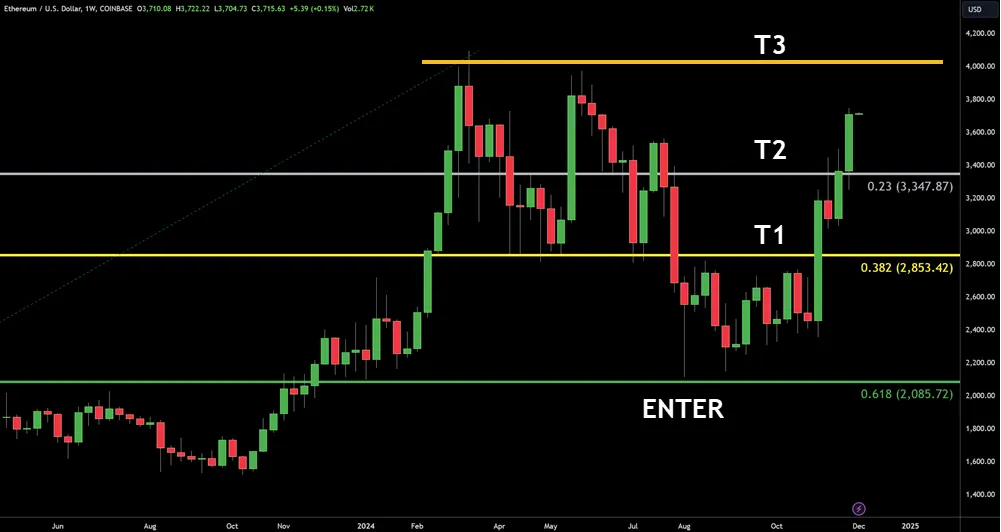
To find an entry point, you should wait for the price to retrace to a major Fibonacci level (like 38.2% or 61.8%) and show signs of bouncing back in the trend’s direction. Look for additional confirmation through support dynamics, such as candlestick patterns or increased trading volume at these levels.
Your exit strategy should align with your risk management plan. You can set profit targets at the next Fibonacci level above your entry point during uptrends, or below during downtrends. It’s smart to place your stop-loss just below the next support level to protect your position.
Remember that trading strategies using Fibonacci retracements work best when the market’s showing a clear trend – they’re less reliable in choppy or sideways markets. You’ll get better results if you combine Fibonacci levels with other technical indicators to confirm your trading decisions. Round numbers often create natural psychological barriers that can strengthen Fibonacci levels when they coincide.
Common Mistakes to Avoid
Despite its popularity among traders, Fibonacci retracement analysis comes with several common problems that can lead to costly mistakes. You’ll want to avoid these Fibonacci misconceptions to protect your trading account and improve your success rate.
One of the biggest common errors is relying solely on Fibonacci levels without considering other technical indicators or market conditions. You shouldn’t ignore important factors like volume, trend direction, or market sentiment.
Another mistake is rushing into trades without proper education resources and practice, leading to poor trader psychology and impulsive decisions.
Many traders also fail to implement proper risk management when using Fibonacci retracements. You should always set stop-loss orders and avoid risking more than 1-2% of your trading capital on a single trade.
Don’t fall into the trap of forcing trades at every Fibonacci level – not all levels will result in meaningful price reactions.
Remember that Fibonacci retracement isn’t a magical solution. You’ll need to combine it with other analysis tools, maintain emotional discipline, and continuously educate yourself about market structure and tendencies to use it effectively.
Your Questions Answered
Can Fibonacci Retracements Predict Market Crashes or Major Economic Downturns?
While Fibonacci retracements can help identify market psychology and trader sentiment, they can’t reliably predict major crashes or economic downturns.
You’ll need to combine them with other economic indicators and historical patterns for a more complete market analysis.
They’re better used as a risk management tool within your broader trading strategy rather than as a crystal ball for significant market events.
How Long Should I Wait Before Confirming a Retracement Level Holds?
You’ll want to wait for multiple confirmation signals before trusting a retracement level, typically 1-3 candles depending on your timeframe considerations.
The ideal waiting period varies with market volatility impact – in choppy markets, wait longer.
Watch for supporting signals like volume, price action, or technical indicators.
Don’t rush your decision, as trader psychology factors often push people into premature entries.
Do Fibonacci Levels Work Better in Certain Markets or Timeframes?
Fibonacci applications tend to work better in markets with clear trending patterns and moderate volatility.
You’ll find them most effective in forex and stock markets, where price movements are more structured.
While they can work on any timeframe, daily and 4-hour charts often provide more reliable signals as they filter out market noise.
Your trading strategies should adapt to these patterns, focusing on timeframes that match your trading style.
What Percentage of Successful Traders Regularly Use Fibonacci Retracement in Their Strategy?
While there’s no definitive data on how many successful traders use Fibonacci patterns, you’ll find they’re commonly part of many professional trading strategies.
Trading psychology studies suggest around 30-40% of technical traders incorporate Fibonacci levels for trend confirmation and risk management.
However, you won’t find top traders using them alone – they’re typically combined with other technical analysis tools for better results.
Are There Specific Trading Indicators That Work Best With Fibonacci Retracement?
You’ll find several indicators that pair exceptionally well with Fibonacci retracement.
The RSI (Relative Strength Index) and MACD work as strong confirmation tools, while moving averages help validate support and resistance levels.
Trader testimonials suggest combining these with Fibonacci extensions analysis improves accuracy.
Market psychology influences these combinations, and historical performance reviews show they’re most effective when you’re looking for trend reversals or continuation patterns.
