- April 28, 2021
- Posted by: CoachShane
- Category: Trading Article

Trading trend reversals using the Mass Index technical indicator can help you avoid trying to “catch a falling knife”. It does this by giving you a heads up to when the trend reversal could be taking place.
Not only that, it will give you a signal that the reversal is probably taking place which allows you to adjust your trading strategy.
How does the Mass Index do that?
When Donald Dorsey invented the Mass Index (volatility indicator), he did so on the idea that when a trend is changing, we start to see a widening in the range of price. Price action traders will use the term exhaustion thrusts or even failure tests, which indicate a last gasp for buyers or sellers.
We see an expansion in price (High-Low range) and that will often times be a sign of potential reversals in price, even a short lived one.
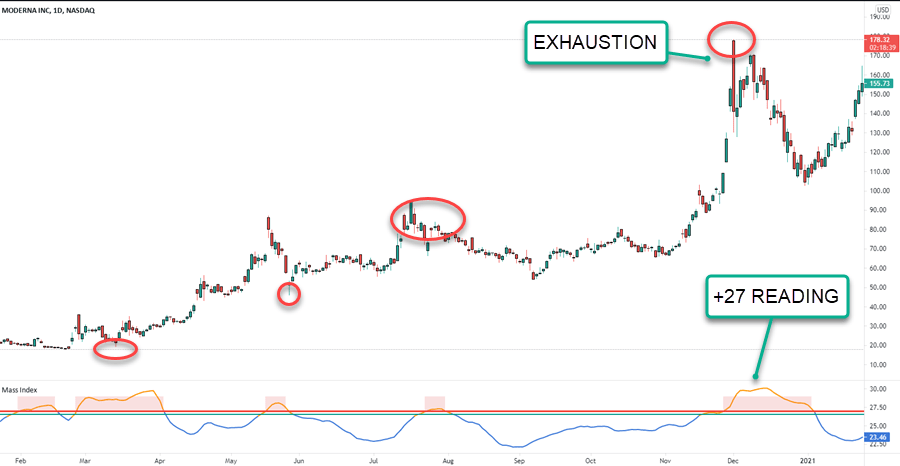
You can see on the chart below a few examples of a bullish trend reversals (except the last one) where price made obvious pushes in one direction and then flipped the other way.
 The +27 reading is what you are looking for to give you the heads up that a trend reversal could be imminent. It is not a trading signal to buy or sell simply by reaching that level.
Essentially, you will be looking for a reading over 27, known as the “Reversal Bulge” and then using your tools and tactics to enter a trade.
How To Use The Mass Index Indicator In Your Trading
Now you know it’s essentially a volatility indicator that looks for the range of previous periods to expand.
Using various calculations involving EMAs, default setting of 9 periods, the indicator plots a line and when it exceeds +27, a reversal could be about to occur.
There is another level, the horizontal green line above, that is set at 26.5. This is a confirmation that the reversal is underway.
There is nothing magic about it and why the EMA over SMA or 9 or 10 was chosen, who knows. The key is whether you will find use in it to improve your trading. Some people will, some won’t.
You will use the indicator to spot potential trend reversals to either lighten a position or trade the actual reversal.
Mass Index + Technical Analysis
Whether you are using trend line, previous price pivots, or individual price patterns, you can’t go wrong using straight up price.
Remember, just because the indicator crosses the +27 threshold, it does not mean price will rip in the other direction. It is a warning…the potential of a change.

Looking at this stock chart, we see the indicator has broken above 27 so we are looking for signs of a change of trend direction.
Drawing trend lines need rules and one of mine is having to connect the last swing into highs (or lows).
Trend line is broken, bearish trend reversal confirmed, and we trade the first pullback in price once it begins to head to the downside.
Mass Index + Pending Orders
Remember the 26.5 number I mentioned earlier?
We could use that as a setup but need confirmation of price moving in our direction. We can do that by using pending orders.

All we do here is look for the +27 level to be broken.
Watch the line drift under 26.5 and place an order, in this case short, under the low of the small range.
If price continues to the downside, you are triggered into the trade.
Adjust The Settings
As with most indicators, you are able to adjust the settings of the Mass Index.
When facing market conditions that are low volatility, you may want to adjust for quicker settings. I say may because I generally do not adjust the default settings.
You may also consider doing so with a short term trading approach.
But, as I always say……
Looking for the perfect setting can take you down the rabbit hole. Wasting time looking for the magic input while you should be working your strategy is not the best choice.
Conclusion
The Mass Index is measuring the range of price over a set period. In doing so, it takes advantage of a natural evolution of price when we are looking at potential trend reversals.
Price exhaustion (expansion) is measurable with other indicators as well including the Keltner Channel. This indicator just gives it a different look.
Is it perfect? No. There is not a perfect indicator out there and you have to have some knowledge of how price moves to be successful.
As always, test out everything before risking money. Design a trading plan and stick with it.
