- December 9, 2024
- Posted by: Shane Daly
- Categories: Advanced Trading Strategies, Trading Article, Trading Indicators
You’ve heard mixed opinions about moving averages as market predictors, and there’s good reason for this uncertainty. While academic research hasn’t completely dismissed these technical indicators, it’s revealed a more refined reality than many traders might expect.
The evidence suggests that moving averages can’t consistently outperform simple buy-and-hold strategies, yet they aren’t entirely without merit. Their effectiveness often depends on specific market conditions, asset classes, and how you combine them with other analytical tools. Before you commit to any trading strategy based on moving averages, you’ll want to understand what the research actually tells us about their predictive power.
What are Zero-DTE Options? => Download “Zero-DTE Options Trading Secrets” right here
TLDR
- Research shows moving averages have limited predictive power, with most combinations failing to outperform random trading strategies consistently.
- Statistical evidence indicates performance differences between various moving average strategies become insignificant when eliminating look-ahead bias.
- Studies demonstrate moving averages work better when combined with other technical indicators, price action, and fundamental analysis for market prediction.
- Historical data analysis confirms moving averages can identify support and resistance levels, though effectiveness varies across different market conditions.
- Academic findings suggest hybrid models incorporating AI with moving averages provide more reliable market predictions than moving averages alone.
Moving Average Research Findings
Moving average research reveals a truth about these popular technical indicators. When you look at the data closely, you’ll find that moving averages barely perform better than simple buy-and-hold strategies. This means that despite their widespread use, their predictive power is quite limited.
You might be surprised to learn that most moving average combinations don’t significantly outperform random buying and selling. As demonstrated in the S&P 500 index analysis, hypothesis testing confirms these findings.
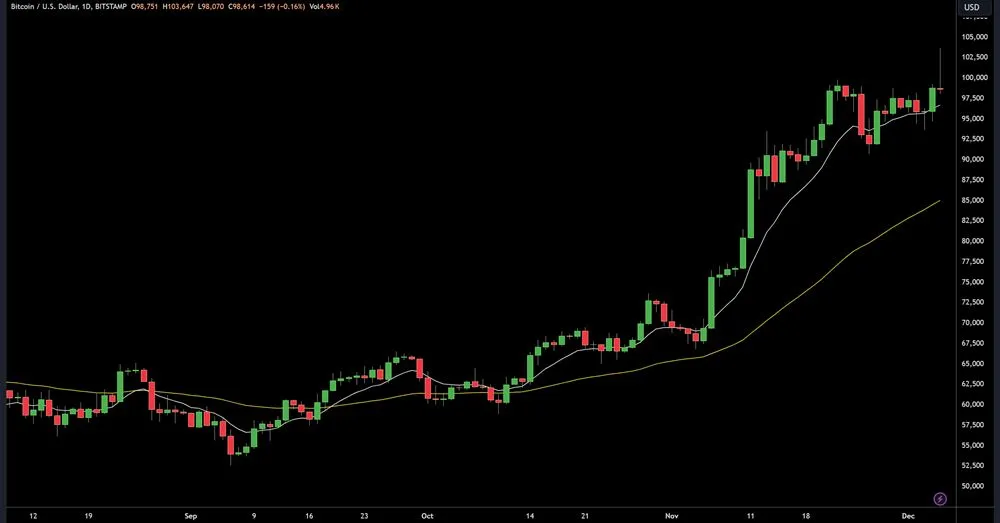
The golden cross signal remains one of the most widely recognized technical patterns for identifying potential bullish trends in the market. Is there a way to better use the crossover? Probably. Use price action along with it.
The exponential moving average offers more weight to recent price data but still faces similar performance limitations. The moving average limitations become even more apparent when you consider that these indicators rely heavily on past data without accounting for future market changes.
In fact, research shows that when you remove look-ahead bias from simulations, the performance difference between moving average strategies and basic buy-and-hold approaches becomes statistically insignificant.
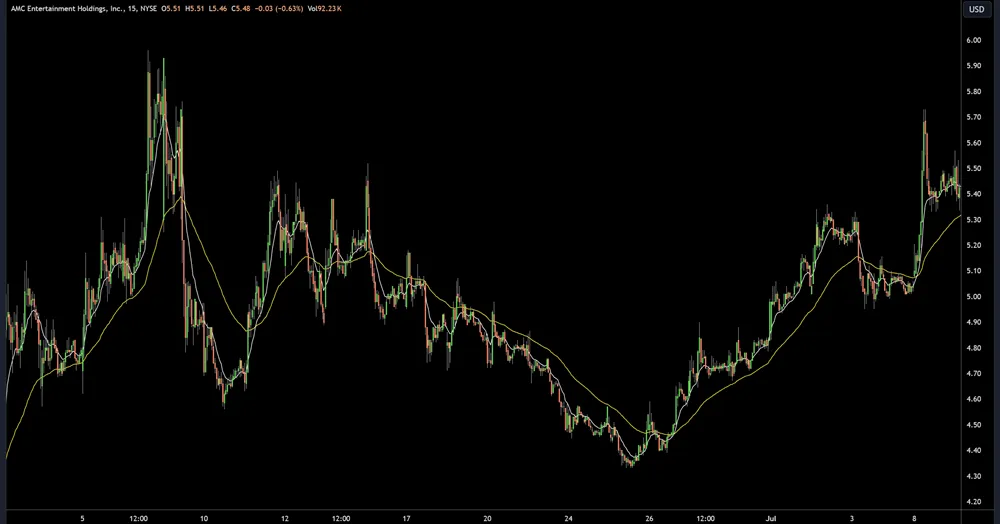
What’s particularly important to understand is that moving averages work differently depending on market conditions. They might seem helpful during certain periods but can be horrible in others, especially in highly volatile markets.
When you’re making investment or trading decisions, remember that moving averages are just one tool among many, and they shouldn’t be your only guide for market predictions.
Hybrid Models Performance Analysis
Combining artificial intelligence with human knowledge, hybrid models have transformed how we analyze market performance beyond traditional moving averages. With adding in hybrid models, you’ll find that these systems effectively blend automated data analysis with human expertise to deliver more accurate market predictions and risk assessments.
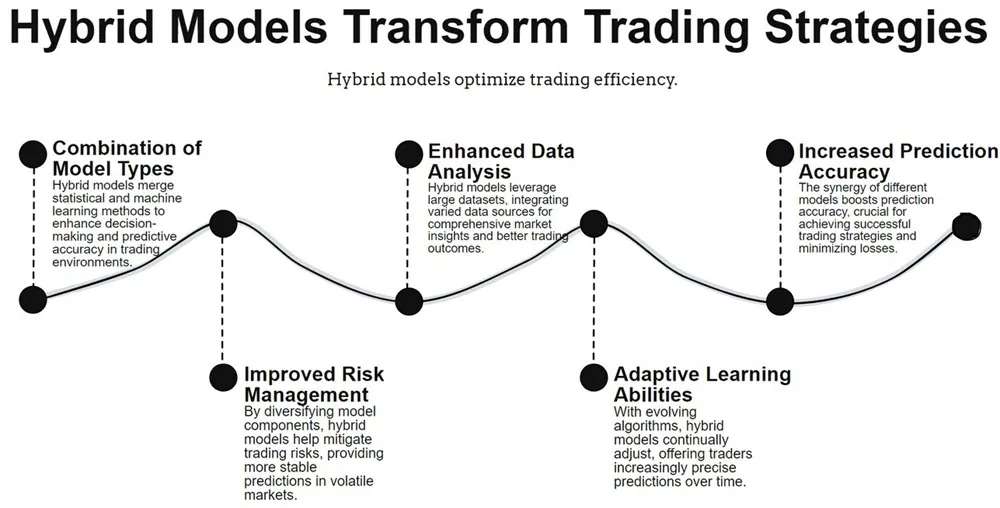
Market dynamics strongly influence how these models adapt to varying timeframes and volatility levels. Similar to how MACD trading strategies use momentum features for better decision-making, hybrid models excel at identifying market trends.
When examining performance metrics, you’ll notice that hybrid models do very well in portfolio optimization by analyzing a ton of market data while also using human judgment. They’re particularly effective at spotting patterns that might escape traditional analysis methods.
Feedback loops are continuously improving AI algorithms and trading strategies through iterative learning (trying, failing, learning, repeat).
These models are especially useful for risk management, as they can process multiple data sources at the same time to identify potential threats to your positions. They’re also helping financial teams make better decisions by automating routine analysis tasks while still using the critical human element in final decision-making.
Short Vs Long Term Indicators
Moving averages fall into two distinct categories that serve different purposes: short-term and long-term indicators. You’ll find that short-term indicators, which generally span 10-50 days, are more sensitive to daily price movements and help capture immediate market trends.
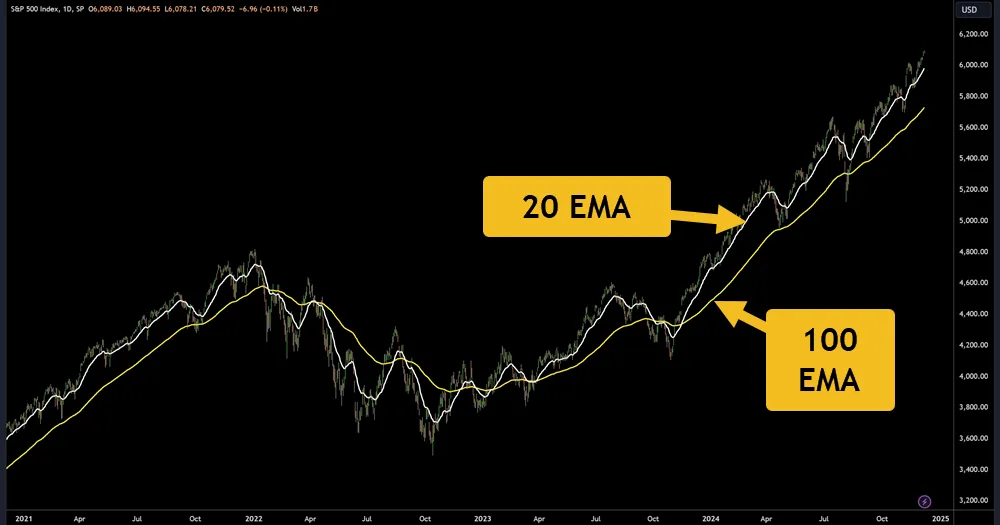
However, they’re also more prone to short term volatility, which can sometimes lead to “false” signals.
On the flip side, long-term indicators covering 100-200 days offer long term stability and provide a better picture of the market’s overall direction. They’re less susceptible to daily fluctuations but might miss quick profit opportunities. Breaking the MA often signals potential trend reversals that traders should carefully monitor. Simple moving averages provide reliable support and resistance levels for long-term analysis.
| Feature | Short-Term | Long-Term |
|---|---|---|
| Time Frame | 10-50 days | 100-200 days |
| Volatility | High | Low |
| Signal Accuracy | Less reliable | More reliable |
| Trading Style | Day/swing trading | Position trading |
When you’re trading, it’s smart to use both types of indicators together. Short-term averages can help you time your entries and exits, while long-term averages confirm the broader trend.
Technical Decision Making Studies
When analyzing market behavior through technical studies, successful decision-making depends on understanding how moving averages influence price action.
You’ll find that these technical indicators serve as dynamic support and resistance levels, helping you identify potential entry and exit points in the market. While it may appear price bounces at the average, look left. You will no doubt see supply and demand zones or standard support/resistance areas that price is reacting to.
Research shows that while moving averages are valuable tools for trend analysis, they shouldn’t be your only decision-making factor. The risk of over-reliance on moving averages as a sole indicator can lead to missed opportunities or losses.
You’ll want to pay attention to how prices interact with different types of moving averages – whether they’re simple, exponential, or weighted.
When prices stay above the moving average, it’s typically indicating an upward trend, while prices below suggest a downward trend.
It’s important to note that academic studies have found only a few moving average combinations perform better than random trading, and none consistently beat market returns.
You can improve your analysis by combining different moving average lengths and watching for crossovers, which often signal potential trend changes. Never trade the cross. Trade the retest.
Remember to use these indicators as part of a broader strategy, understanding that they’re better at confirming existing trends than predicting future market behavior.
Your Questions Answered
How Do International Market Holidays Affect Moving Average Calculations?
When international markets close for holidays, you’ll see gaps in your moving average calculations that can impact market efficiency.
These gaps affect your data’s accuracy, especially when markets reopen with holiday volatility. You’ll need to handle missing data carefully – either by ignoring holidays, interpolating values, or adjusting your calculations.
It’s best to use longer-term averages during these periods, as they’re less sensitive to holiday-related price swings.
What Role Does Trading Volume Play in Validating Moving Average Signals?
When you’re analyzing moving average signals, trading volume plays a role in validating price movements.
You’ll want to watch for volume spikes during trend confirmation, as they often indicate stronger market conviction. High volume supports the reliability of your signals, while low volume might suggest weaker trends.
During periods of market volatility, volume becomes even more important, as it helps you understand trader psychology and distinguish between genuine trends and false signals.
Can Moving Averages Predict Market Behavior During Black Swan Events?
You can’t rely on moving averages to predict black swan events, as these rare occurrences are, by definition, unpredictable.
Moving averages are based on historical data and patterns, but black swan events break all normal market patterns.
While you might use moving averages as part of your trading strategy, they won’t help you anticipate these extreme market shocks.
It’s better to focus on risk management and diversification to protect against such events.
How Do Corporate Actions Like Stock Splits Impact Moving Average Accuracy?
When companies announce stock splits, they’ll significantly affect your moving average calculations if you don’t adjust your data properly.
You’ll need to use split-adjusted historical prices to maintain accuracy in your analysis. If you don’t account for these corporate announcements, your moving averages won’t reflect true market volatility or price trends.
Most modern trading platforms automatically adjust for splits, but you should always verify this to ensure your analysis remains reliable.
What Minimum Data Sample Size Ensures Reliable Moving Average Predictions?
You’ll want to use at least 30-50 data points to ensure reliable moving average predictions.
Data continuity is important, so make sure your sample duration covers both up and down market cycles.
While longer periods (100+ data points) can provide more stable signals, they’re not always necessary.
The key is maintaining consistent data quality rather than focusing solely on quantity.
Consider your trading timeframe when choosing your sample size.
