With so many technical indicators to choose from, there is always the question of the best ones to use. In fact, the question of using a Simple Moving Average Or Exponential Moving Average, is a common one. It gets worse when asking about best settings because traders are always looking for an edge.
While both EMA and SMA are useful in showing the average of price data over a fixed period, we are going to answer the questions:
Which moving average is better? What is the best setting for easy gains? Does it even make a difference?
Simple Vs Exponential Moving Averages – Overview
All things being equal, the main difference between the SMA and EMA is the calculation which influences how they react to price.

The simple moving average calculation is a standard average of N periods. Each price plot is given the same weight in the calculation and you get a true average price for whatever lookback period you have chosen. The SMA tends to be slower in reacting to price movements including sudden spikes in price. The SMA tracks further away from the price bars in a trending market compared to the EMA.
The exponential moving average formula contains a weighting factor for the most recent price plots. This weighting makes the EMA quicker to respond to sudden price spikes. Because of the faster response to changes in recent price, the EMA will track closer to price. Keep in mind that when using an indicator for trading decisions, the faster it reacts to current prices, the more chance of getting a false signal occurs.
Consolidations
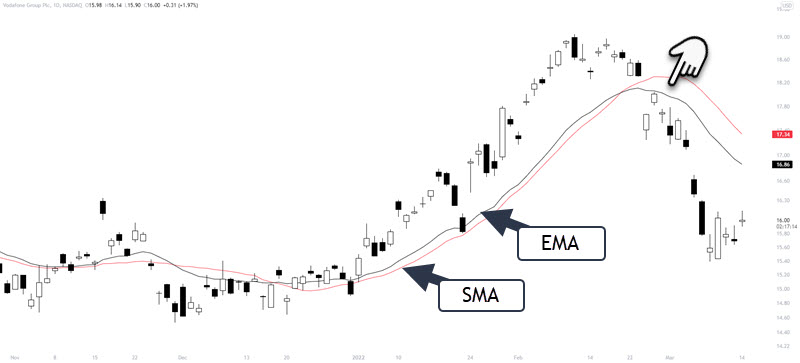
One important area to note is on the left of the chart. As moving averages are averages of price using the closing price, when markets begin to consolidate and closing prices are closer to each other, price will whip around the moving average. For breakout traders, a quick scan using a moving average can give you a list of instruments in a consolidation.
Another area is on the right with the pointer. The gap down is a good example of how the EMA reacted faster than the SMA to price movement. While the SMA kept climbing, the EMA reversed direction to the downside and as mentioned, this is due to the most recent data having more meaning in the calculation than the previous data.
For the most part and during a steady move, there is very little difference between the two moving averages at the same lookback period.
Do Larger Time Periods Make A Difference?
The last example used one of the more popular settings of 20. If we go out to a common trend following period of the 200-Day SMA and EMA, is there a difference?

Regardless of how you use moving averages for your trading, would you do anything differently with either of these averages? Probably not. The green arrow does show where the EMA reacted to the large move however it didn’t add any useful information to any strategy that I can think of.
Trading Approaches
There are many ways a trader will use a moving average in their trading strategies and personally, price action plays a bigger part in my own trading. The average is just to help frame the market and no trading decision is made based on the average itself.
To help determine whether you should use an EMA or SMA, let’s look at determining the trend with a price cross and trading a pullback to around the average.

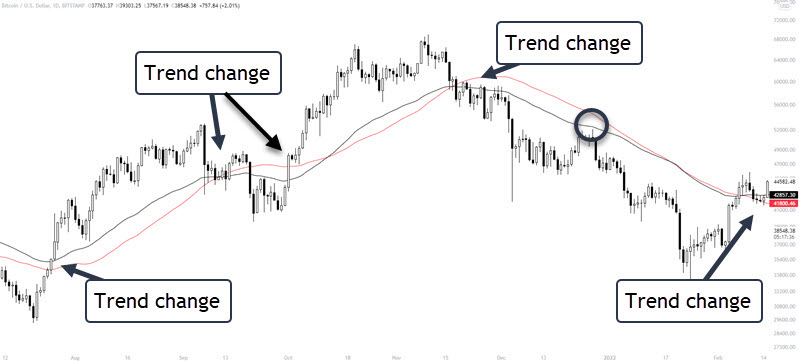
If we consider the trend changes with price crossing an average, it makes little if any difference to bias. In fact, in the middle of the chart, a double top formation and price direction breakdown gives a trend change faster than either average.
With pullbacks to an area around the averages, the only issue is the black circle where it doesn’t touch either average. For most traders, close is close enough and price action, where price ranged and broke down, is enough for a short trade.
Which Moving Average To Use
The difference between the EMA and SMA is minimal and should not make much of a difference in a robust trading strategy. In regards to best settings, just like the type, there is no best setting.
Short term traders who enjoy faster indicator movements as part of their strategy, may opt for a 10-day EMA or SMA. A trader may be looking for a short term consolidation and will use price hugging the 10 period SMA as a trigger to start looking for a breakout trade.
Longer-term traders who don’t care for more responsive indicators may choose a 50-200 period SMA for a trend indicator. As we saw in comparing the 200 EMA and SMA, being more responsive with the EMA made little difference.
You could even use something like the 100 SMA for longer term trend direction and a 10 EMA for corrections against the main trend.

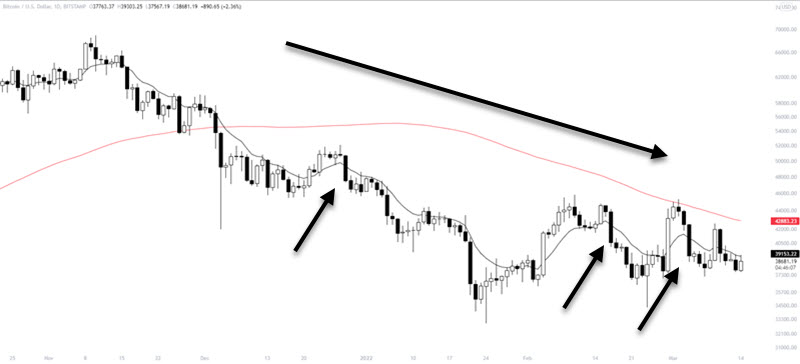
Using a recent chart of Bitcoin, the 100 SMA is showing a downtrend trend as price is trading below it.
Price rallies above the faster 10 EMA and upon a close below the average, a trader could sell. This is not a trading strategy you should start trading without some testing. You need to determine how much price action is needed on the opposite side of the EMA. Is a close below enough for a trade entry or do you need the whole candle?
Bottom Line
There is no best moving average or best period setting. Want quicker action for some reason? Use a shorter period moving average but be aware of false signals.
Do you just prefer to see price smoothed on your chart for a birds eye view of the market? Use a 20,50,200 SMA.
In the end, a robust trading strategy should not depend on either the type of moving average or slight variations in period settings. We are simply looking at an average of closing prices, generally, over a period of time. That period of time can be a short period of 20 or long periods of 100+.
It is what you do with that information that matters.
