- May 22, 2023
- Posted by: Shane Daly
- Category: Trading Article

For stock traders, momentum indicators can be an effective tool when used as part of a complete trading strategy. These are worthwhile for swing traders to invest the time to learn about, to help recognize price trends and strength to entry and exit locations.
We’ll go over momentum indicator basics, how to pick the best swing trading indicator for your trading approach, and how to use momentum oscillators to improve your odds of success.
Understanding Swing Trading with Momentum Indicators
Indicators are incredibly useful technical analysis tools that track the speed and intensity of a security’s price movement. You get an objective perspective in identifying trends and signaling potential price moves that could be coming.
For swing trading, these momentum indicators help confirm the direction of the trend and pinpoint the optimal moments for entering and exiting trades. Although they are lagging indicators, a lot of swing traders still achieve success using them.
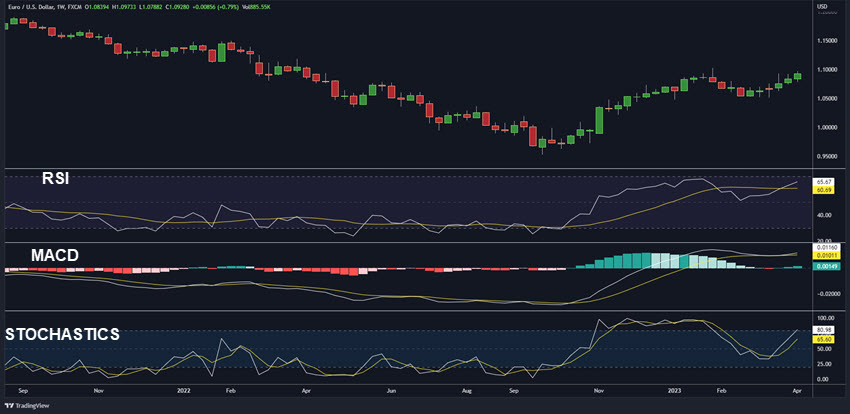
Swing traders have a wide range of momentum indicators at their disposal, and some of the top swing trading indicators include the:
Relative Strength Index (RSI) | Moving Average Convergence Divergence (MACD) | Stochastic Oscillator
By using a combination of these indicators, you get a better understanding of past price action and if the current market conditions fit your trading strategy. A multi-indicator approach helps traders capitalize on the market’s momentum while mitigating the risk of relying on a single indicator.
Benefits of Swing Trading with Momentum Indicators
Swing trading with momentum trading indicators offers numerous advantages for traders:
Validate trend direction

If both RSI and MACD indicate a bullish trend, a trader might be more confident in taking a long position or increasing their position sizing.
Momentum decreasing
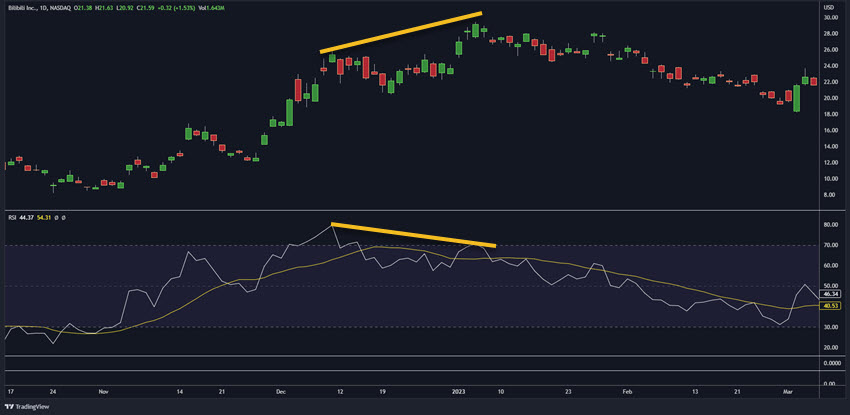
If a stock’s price heads in the opposite direction from the RSI indicator, this may suggest that the trend is weakening and that it’s time to close the position.
Objective input
By relying on data-driven indicators rather than emotions or gut feel (although that can be important for experienced traders), you can eliminate biases and improve your decision-making process.
Trend + Momentum
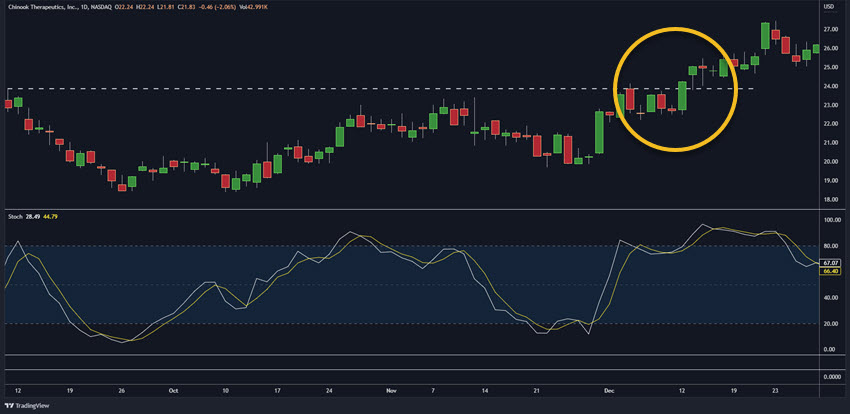
By combining trend analysis with momentum analysis, you can pinpoint higher probability trade locations that have the potential to head in your direction.
For example, if a stock’s price breaks out of a consolidation pattern and the Stochastic Oscillator confirms strong upward price movements, a trader may be more confident in entering a long position.
6 Tips for Successful Swing Trading with Momentum Indicators
Develop a Comprehensive Trading Plan
Establishing a detailed trading plan is the most important thing you can do as a trader. A well-defined plan outlines your entry and exit points, profit targets, and stop-loss levels, and keeps you disciplined, and focused on your trading objectives.
Without a plan, you will eventually be involved in emotional and impulsive trading decisions (FOMO), which can result in losses.
For example, by specifying a 2% stop-loss level or exiting if the price breaks a support zone, you can ensure that a losing trade doesn’t significantly impact your overall capital.
Master Market Trends and Patterns
To be successful with swing trading, you need to be able to spot trends and chart patterns. Some traders will closely monitoring economic and political developments, to help them spot opportunities that may provide the steam for profitable trades.
Implement Robust Money Management
Money management plays a vital role in successful swing trading. It involves using stop-losses and risk management techniques to minimize losses and protect the gains while in a trade. A popular money management strategy involves risking only a small percentage of your trading account on each trade, such as 1% or 2%.
It’s also important that you avoid overtrading, which can result in excessive risk exposure and significant losses especially during a run of losing trades. Adopting a disciplined and conservative approach to money management, especially when starting out, can help you maintain profitability over time. Leverage The Best Swing Trading Indicators
Technical analysis indicators offer valuable and objective insights into the market, helping you identify trades that have the potential to be profitable. These indicators can signal potential buying and selling opportunities, helping you in making trading decisions in line with your trading plan.
It’s also important that you not rely solely on technical indicators but use them alongside other analysis methods such as chart patterns.
Incorporate Risk/Reward Ratios
Incorporating risk/reward ratios into your trading plan can help ensure long-term profitability. A risk/reward ratio measures the amount of risk taken relative to the potential profit.
An ideal risk/reward ratio should be at least 1:2, meaning that you stand to gain at least twice as much as you are risking. By using this technique, you can increase the likelihood of profitable trades while minimizing losses.
For instance, if you enter a trade with a potential profit target of $200 and a stop-loss level of $100, your risk/reward ratio would be 1:2. By consistently maintaining this ratio, you can offset losses with larger gains, ensuring long-term profitability in your swing trading endeavors.
Keep in mind that there is no guarantee you will ever reach your risk-reward goals. Price can move in any direction regardless of your potential profit targets.
Remain Disciplined and Stay Focused on Your Strategy
By designing complete trading strategies and staying committed to them, you give yourself a chance to stay away from impulsive and emotionally-driven trading decisions.
For example, disciplined swing traders might have a rule that requires them to sell a stock if it drops below a specific moving average or if the RSI indicates an overbought condition.
By consistently following these rules, the trader can minimize losses and maintain a clear trading strategy.
Staying focused on your strategy also means consistently analyzing your trades and performance, as well as fine-tuning your approach when needed. This process involves reviewing past trades to pinpoint areas for improvement or adjusting your strategy to better adapt to shifting market conditions.
Techniques for Swing Traders
Identifying Support & Resistance Levels:
One of the most effective techniques for swing trading is recognizing support and resistance levels. This is where momentum and volume indicators can be extremely valuable.
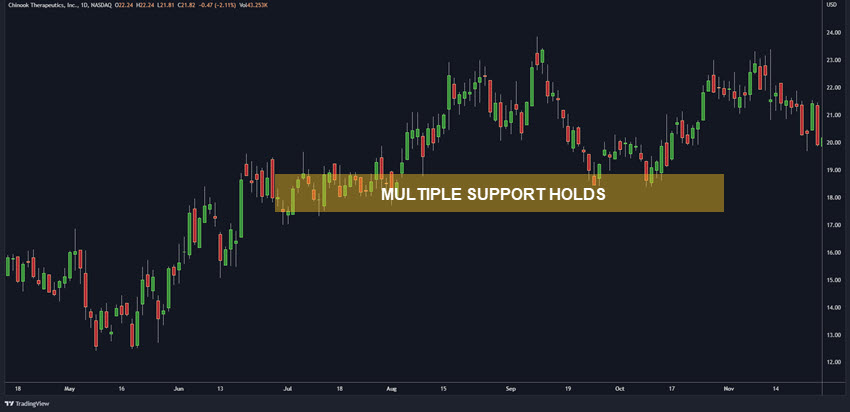
To spot support and resistance zones, traders should search for areas where the stock price has reversed and areas where a newly formed trend developed from.
If the pullback occurs on weak volume into the level and it’s not part of a bearish trend, you might have a solid setup especially if the momentum indicator turns to the upside.
Identifying Price Momentum Moves:
Another effective technique for swing trading is pinpointing momentum moves. This approach involves finding stocks that are experiencing momentum in a particular direction.
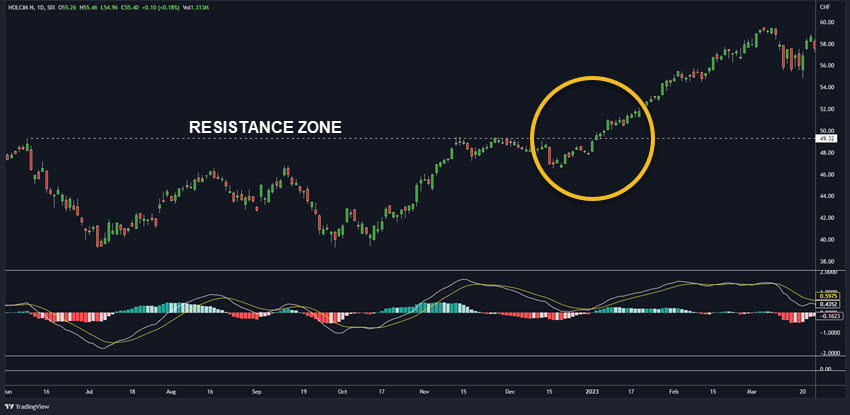
After identifying the momentum moves, traders can enter trades with those stocks to capitalize on the price volatility, then exit the trade when the momentum begins to wane.
These moves typically occur after the price has been in a range with low volume for a few days or even several weeks.
Trading Reversal and Continuation Patterns:
Trading trend reversal and continuation patterns is another technique for swing trading.
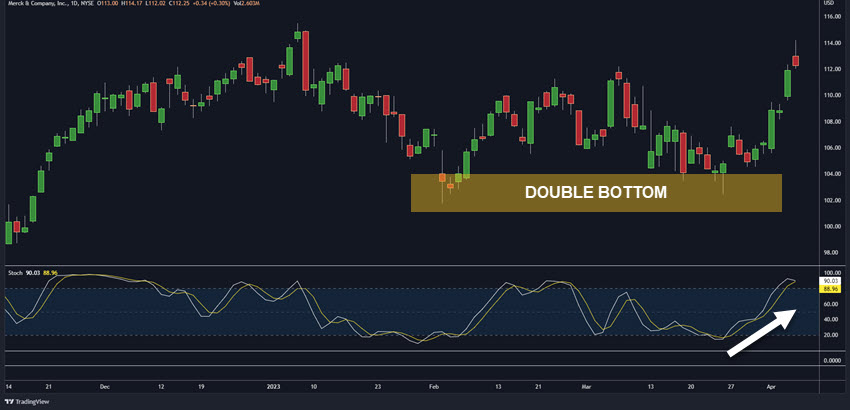
Reversal patterns suggest that a trend reversal might be happening, while continuation patterns indicate that an existing trend is likely to persist.
Some popular reversal and continuation patterns include Head and Shoulders, Double Top, and Double Bottom.
Momentum indicators can be incredibly useful in identifying and confirming trade opportunities when these patterns appear.
Utilizing Moving Averages:
Many traders will use trend indicators such as moving averages as the main indicator whether day trading, swing trading, or scalping.
The most commonly used moving averages are the 20/50-day moving average and the 200-day moving average which show a medium and longer-term trend direction.
By using moving averages, traders can recognize trends and potential areas of support or resistance. When the price arrives at an average, look to the left of current price for any signs of price structure.
Finding High Probability Setups:
Traders using momentum indicators for swing trading should strive to find high-probability setups. High-probability setups are the setups that are more likely to result in profitable trades.
These setups can be identified by looking at price action, support and resistance levels, oversold and overbought levels, momentum moves, and volume. There are potential patterns all over the chart that traders will attempt to trade.

Pay attention to the confluence of variables for this pullback trade:
+ Rising 50 SMA for trend confirmation
+ Bull flag pattern that ends at a double bottom
+ Stochastics is not overbought and is hooking to the upside.
By focusing on several variables that line up, there is a higher probability that price will travel in your direction. How far it will run, nobody knows.
The higher probability setups will appear at price structure levels, chart patterns, and when momentum is stepping into the instrument.
Common Pitfalls in Swing Trading with Momentum Indicators
Despite the benefits of these indicators, there are some common pitfalls that traders should avoid.
Depending on indicators or a combination of indicators for your strategy leads to analysis paralysis. The average trader needs to include some type of price pattern/action reading.
Using too many indicators or conflicting indicators can create confusion and false signals. You may see one indicator showing an increase in momentum while the other shows a decrease.
Not adjusting your trading strategy to changing market conditions can lead to losses.
Conclusion
Mastering swing trading with momentum indicators involves understanding the basics of technical analysis tools, such as the Relative Strength Index (RSI), Moving Average Convergence Divergence (MACD), and Stochastic Oscillator.
These tools can help traders confirm trend directions and pinpoint optimal entry and exit points. Successful swing trading requires a comprehensive trading plan, effective money management, and a disciplined approach to identifying high-probability setups using support and resistance levels, reversal and continuation patterns, and moving averages.
By leveraging momentum indicators and maintaining a strong focus on strategy, swing traders can improve their odds of success in the market.
Common Questions
What is swing trading?
Swing trading is a trading style that focuses on capturing short- to medium-term trends in stocks, typically over a few days to several weeks.
Which momentum indicators are best for swing trading?
Some of the most popular momentum indicators for swing trading include the Relative Strength Index (RSI), Moving Average Convergence Divergence (MACD), and Stochastic Oscillator. You need to find the indicators that work best for your unique trading style and strategy.
How do I create a trading plan for swing trading?
A trading plan should include your trade setup criteria, entry and exit points, profit targets, stop-loss levels, and risk management strategies. You can also outline the technical indicators you’ll use to help make your trading decisions. A well-defined trading plan helps you stay disciplined and focused on your trading goals.
How much money should I risk on each trade?
You need to be able to withstand a string of losing trades. Keeping your risk to .5-2% on each trade is a conservative approach.
Can I use momentum indicators alone to make trading decisions?
Momentum indicators are valuable tools for swing trading, but it is essential to use them with other analysis methods, such as chart patterns and price action.
Common pitfalls in swing trading with momentum indicators?
Some common pitfalls include using too many indicators or conflicting indicators will lead to confusion when it comes time to make a decision. Relying solely on technical indicators without considering price action and chart patterns, and not adjusting your trading strategy/expectations to changing market conditions is another issue.
Tired Of Trading With Overused Indicators?
Try something different and get the
“Ultimate Guide to Price Pattern Trading” – ABSOLUTELY FREE!
Learn how to trade with precision accuracy, find ideal entry points,
and create a lifetime of trading income using patterns and price action.
Download your FREE guide now and start mastering the art of successful trading!
