- July 19, 2022
- Posted by: Shane Daly
- Category: Trading Article

When it comes to trading stocks, there are a lot of different factors that can affect the success of your trades. One of the more important factors is volume. Volume is the number of shares that are traded in a particular stock during a given period of time.
There are a lot of benefits to trading stocks using volume. For one, it can help you to get a better understanding of the market and the overall interest in the particular ticker. It can also help you make more informed decisions about when to buy and sell.
Volume is also affected by the size of the market. If the market is large, then more shares will move hands, generally, during the session.
What Is Buying Volume
If there are more people in the market at any given moment, you’ll be able to buy and sell larger or smaller amounts of stock, because there are more people who want to fill your order.
 In any market economy, there is a need for buyers and sellers. For example, if I want to buy a car, I will need someone to be selling theirs. If I want to sell my car, I will need a buyer. These transactions require both parties to agree to the terms of the sale.
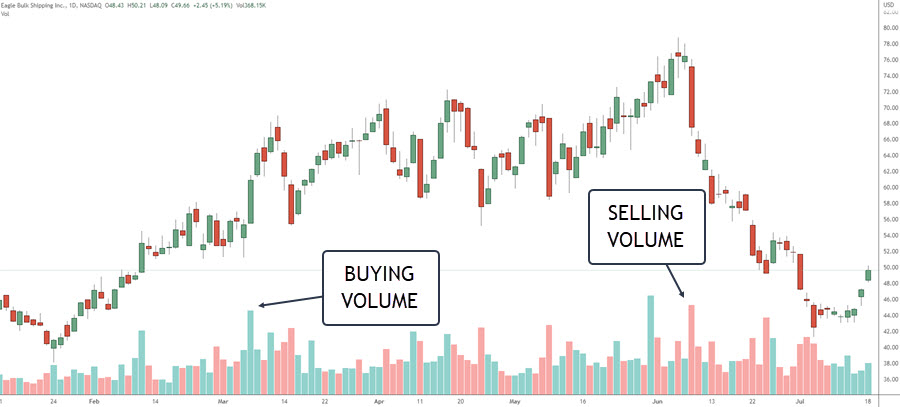
When the price goes up, buyers are currently in control. Volume increases when price is going up and if there is strong interest in the stock. Every time you hit the buy button when trading stocks, your order is registered with the exchange and shows up in the volume output.
Bid: Highest price a buyer will pay to buy a number of shares of a stock
Ask: Lowest price at which a seller will sell the stock
What Is Selling Volume
When the price is heading to the downside, sellers have more control. When the price moves down low enough, sellers will start offering the stock at the lowest price they will sell it for. This is called selling volume and happens at the bid price. A bid is the highest price a buyer is willing to pay for the stock. If someone wants to sell at the bid price, that means the seller isn’t interested in the stock. The bid represents the best price the buyer will pay.
A 15 minute chart shows how many shares are traded during those 15 minutes. A daily chart shows how many shares changed hands throughout the day. These charts are useful because they give an idea of how active the market is and if it is worth participating in.
You can add color to the histogram where a red volume bar means the market price declined and the volume type is selling volume. A green volume bar means the market had risen during that period.
Average Volume
Day trading stocks that are trading with volume allows you to enter and exit a position quickly, whether you’re buying or selling. In fact, short term trading with stocks that have low volume is a sure way to experience slippage.
The average daily volume is the total number of shares traded per day divided by the period you are considering. A high average daily volume indicates that there were a lot of transactions during the trading sessions you are looking at which means there was strong interest in the ticker.
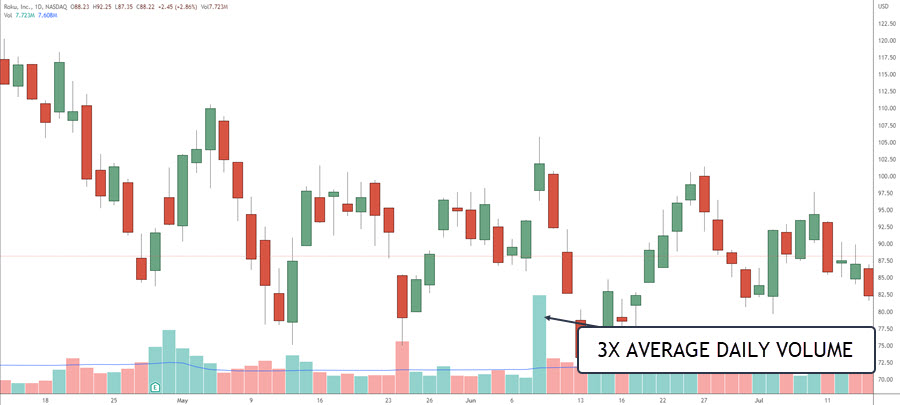
 To determine average volume, many trades will use a 20 period or 50 period moving average of volume. These traders will wait until volume exceeds the average before looking for a position. This chart is using a 50 day moving average of volume and you can see that on the far right edge, it’s trading below the average volume. Traders will need to determine how they would approach this chart or just skip it due to lack of interest.
What Does High Volume Mean?
There will be some days where you will see higher than normal volume. These days often have high volatility and large price moves. If most of the trading is done at the ask price, then the price may go up and the increased volume shows buyers are motivated to buy.
When there is a lot of volume at the ask price, it means many people are buying the stock. If the stock price goes up, it means that the demand is high and the supply low. So if you buy the stock, you’ll generally get the price it’s offered at without experience slippage.
 When you see volume spikes in a stock it can be an indication that something is happening with the company. This could be something positive, like an earnings release, or negative, like a lawsuit. By paying attention to volume, you can get an early indication of these events and make trades accordingly.
Retracements Against The Trend
Volume should be large when prices move in the direction of the trend, and smaller when prices move against the trend. In other words, look for momentum in the impulse move and with the correction, we want to see a lazy pullback. In fact, using a momentum indicator to help determine pullbacks you will buy, is a solid trading strategy.
When high volume accompanies sharp price movements against the current trend, it is an indication that the trend is weakening. If the volume spikes five to ten times above average, it may signal the end of the trend. Exhaustion moves occur when there are no longer enough buyers left to push prices higher.
Volume + Other Indicators
When trading stocks, it is important to use volume in conjunction with other technical indicators. For example, you could use volume to confirm trends or help identify potential support and resistance levels.
However, it is also important to keep in mind that volume is just one of many factors that should be considered when making trading decisions. Other important factors include trend, price history, and momentum.
Some other technical indicators that are often used in conjunction with volume include:
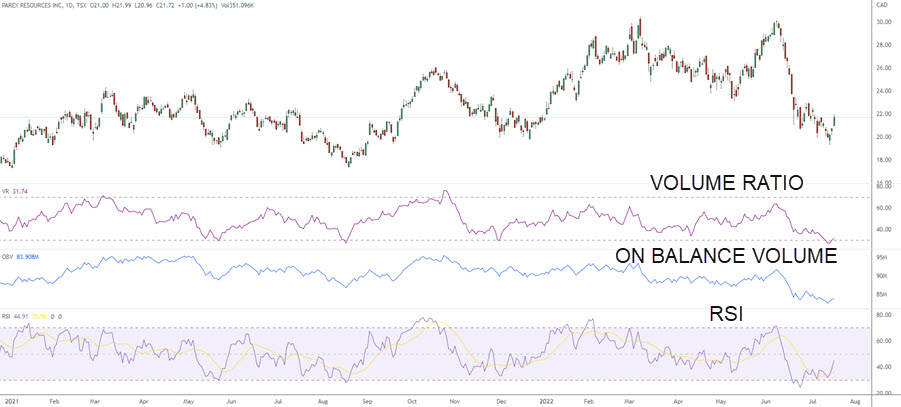
* Price/volume ratio: This indicator measures the relationship between a stock’s price and its volume. A high ratio indicates that the stock is overbought, while a low ratio indicates that it is oversold.
* On-balance volume: This indicator uses volume to assess the strength of a stock’s price movement. A rising on-balance volume indicates that buying pressure is increasing, while a falling on-balance volume indicates that selling pressure is increasing.
* Relative strength index: This indicator is a momentum oscillator that measures the speed and change of price movements A high RSI indicates that the stock is overbought, while a low RSI indicates that it is oversold.
 By considering volume along with other technical indicators, you can get a better sense of a stock’s underlying strength and can make more informed trading decisions.
Wrap Up
Volume is a important technical indicator that can provide valuable insights into the underlying sentiment of the market. By monitoring volume levels, traders can get a better sense of when to buy or sell a particular stock. Of course, it is also important to use other technical indicators in conjunction with volume to make more informed decisions. But volume can be a helpful starting point for finding potential trading opportunities.
